Update (21/06/2016): unfortunately the MindManager Google search map part has ceased to operate due to Google deprecating their old search API and adopting a new one. Consequently Mindjet have announced that they will update and completely rewrite the map part but this means it will not be ready for inclusion in the upcoming version 17. The implication is that it will not be available until version 18 is released in over a year’s time; it also means that no patch is planned for older versions of MindManager. I have expressed my strong concerns via the Mindjet users forum regarding this approach (especially the lengthy delay in releasing a new version of the map part) and intend to pursue this further.
For the time being there is little that can be done; the Google search map part is unusable which means regrettably that all the following information is redundant at least for the time being. Further information can be found here and Mindjet has also started a discussion on options to improve Google search functionality in the new version.
Introduction: The Google search map part and its limitations
MindManager is a great program, but while some features have evolved and new ones have been added, others have pretty much stayed the same. One example of the latter is the Google search map part. This has been around at least since version 8 of MindManager and it along with its counterparts for Amazon and eBay make up the entire collection of web search smart map parts.
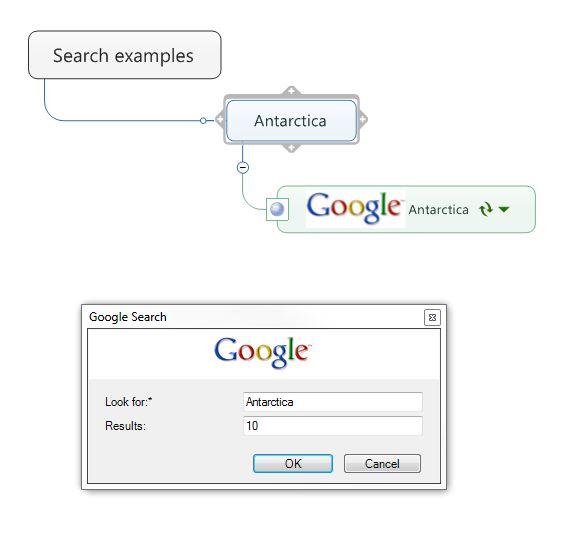
Google search map part and dialogue box
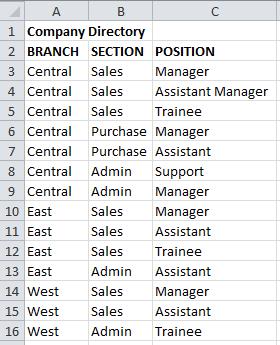
As far as I can tell the Google map part remained largely unchanged over this time, which means it has stayed simple to use but limited in usefulness. Add it to a parent topic or subtopic and it appears in the map, along with a dialogue box which has only two fields: Look for, which becomes populated with the parent topic name, and Results, which is the maximum number of search results that will be displayed and which defaults to 10. So, if the parent topic is, say, “Antarctica”, and you simply hit return you will get 10 research results relating to Antarctica displayed in the map as topics, with hyperlinks to the relevant pages and the first couple of lines of the page in the topic notes.
The problem is that you don’t really have much control over how these 10 particular results were selected. This is because the Google research map part defaults to the basic Google search which in fact has only one field – the search term itself. It would be great if there was a Google Advanced Search map part but there isn’t, but that doesn’t mean that’s the end of the story. It may not be immediately obvious but there’s a surprising range of things you can do within its parameters, some of which I’ll describe below.
Making Google search more useful in four steps
I’ve organised these tips in four steps. The first relates to what you can do to manage the Google map search part in MindManager and how you can create and save customised searches. The other three steps summarise how you can add and use Google search operators and parameters to further customise your searches.
Step 1: The basics – managing the Google search map part

Google search map part and results
The first and most obvious modifications you can make are to the search text and number of results – simply edit these fields in the dialogue box which pops up when you add the Google search map part to a map. Just toggle the expand/collapse button to show or hide the search fields.
You can change the search text completely if you wish – you will be asked to confirm the search term and then the previous search results will be replaced by ones relating to the new text. In this regard it is important to note that while the initial search text is derived from the topic or subtopic to which the map part has been attached, after this point the text of the parent topic and the map search are completely independent of each other.
You can also refresh an existing search by clicking on the refresh button to the right of the search text in the map part – but if you want to save any of the research results which have already appeared you should cut or copy and then paste them elsewhere in the map (or you can simply just drag them), as the refreshed search may come up with slightly different results.
Whether you have edited it or not, once a search has been created it can be saved as a map part and reused. If you want to do this you may also want to format the search topic’s fill colour, line colour or text which you can do in the same way as you would for any other topic. You can also modify any searches after they have been saved as map parts by right clicking on them and selecting Modify. You can also do this with the default map part, but frustratingly one thing you can’t do (as far as I can tell) in the default is change the number of results returned for the search topic from 10.
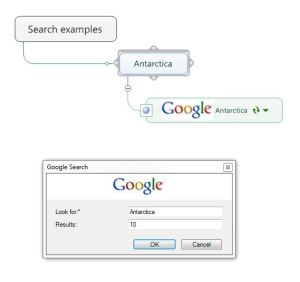
Google search map part results with AND and site operators added
Step 2: Tailor made – using Google search operators to refine your results
Though they may make use of specific examples, such as the minus symbol to exclude specific words or quotation marks to search for specific phrases, many people don’t realise that even the standard Google search has a much wider search operators which can be used to tailor searches.
As the MindManager Google map part is a standard Google search all these operators are also available. I won’t go into the full range, but some of the more useful ones include:
” “ (quotation marks) – as I said, this will force Google to search for the phrase in the quotes, for example “Antarctic explorers“.
– (minus symbol) – excludes pages that contain the word after the minus operator, for example, Antarctic -explorers.
.. (two full stops) – use to express a range of numbers, for example, 20..100 penguins
site – returns searches within a specific domain or site. For example, Antarctica site:abc.net.au returns pages related to Antarctica on the Australian Broadcasting Corporation website, while Antarctica site:.au returns pages on Antarctica which are hosted in Australia.
AND – self-explanatory: Antarctica AND penguins
OR – self-explanatory: Antarctica OR penguins
daterange – will search within a specified date range but is tricky to use. More on this in Steps 3 and 4.
These examples only scratch the surface of what you can do and there are plenty of more detailed guides online. Examples include:
https://support.google.com/websearch/answer/2466433?hl=en
http://www.gryffin.com/guide-to-google-search-operators
https://bynd.com/news-ideas/google-advanced-search-comprehensive-list-google-search-operators/
http://searchengineland.com/google-power-user-tips-query-operators-48126
http://www.googleguide.com/advanced_operators_reference.html
Bear in mind that some of the search operators are undocumented and in fact may not be officially recognised by Google. As a result they may be deleted or changed at any time. For a very comprehensive if slightly out-of-date guide have a look at the book Google Hacks by Rael Dornfest, Paul Bausch and Tara Calishain which is also available online.
Step 3: Searching for a date with Julian – with a little help from Excel
What is a Julian Day Number?
One of the more frustrating things about the standard Google search is that it is not immediately clear whether you can set a date range, unlike the advanced search where it is easily available.
In fact there is a way to set the date range but its operation is more than a little obtuse. This is because the only parameters it accepts are based on the Julian Day Number (JDN,) which is the continuous count of days since the beginning of the Julian Period, a measure used mainly in astronomy. Confusingly the term “Julian date” also refers the practice of representing the date as a combination of the year plus the number of days since the beginning of the year, but this is completely different to the JDN. There are many explanations of the latter but the most succinct is found in Wikipedia:
The Julian Day Number (JDN) is the integer assigned to a whole solar day in the Julian day count starting from noon Greenwich Mean Time, with Julian day number 0 assigned to the day starting at noon on January 1, 4713 BC, proleptic Julian calendar (November 24, 4714 BC, in the proleptic Gregorian calendar), a date at which three multi-year cycles started and which preceded any historical dates. For example, the Julian day number for the day starting at 12:00 UT on January 1, 2000, was 2,451,545.
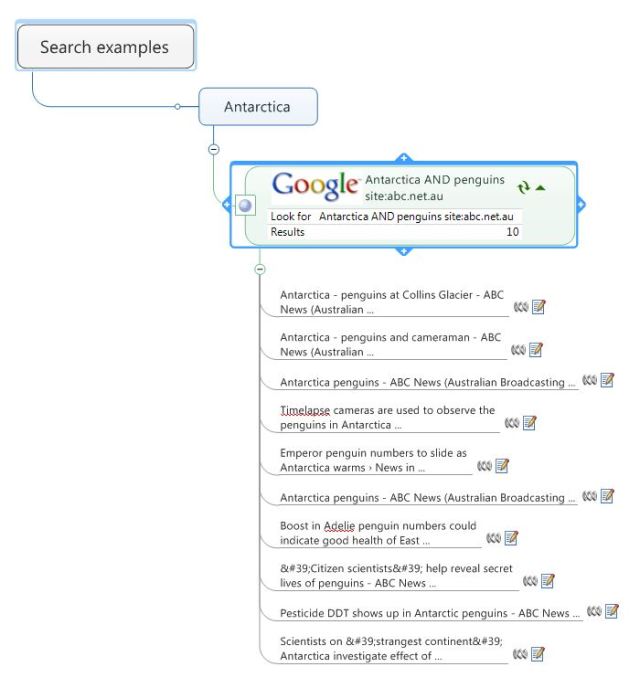
So if for example you wanted to search for mentions of Antarctica made in the week from Monday 14 to Monday 21 December 2015 the expression that you would enter in the Google map part (or into a standard Google search outside MindManager) would be Antarctica daterange:2457370-2457377. Before I go any further I should say that I understand that the daterange function is one of the search operators not officially supported by Google, which does not guarantee the results. It seems to work fairly reliably for me, however.
How to calculate and use a JDN in a Google search
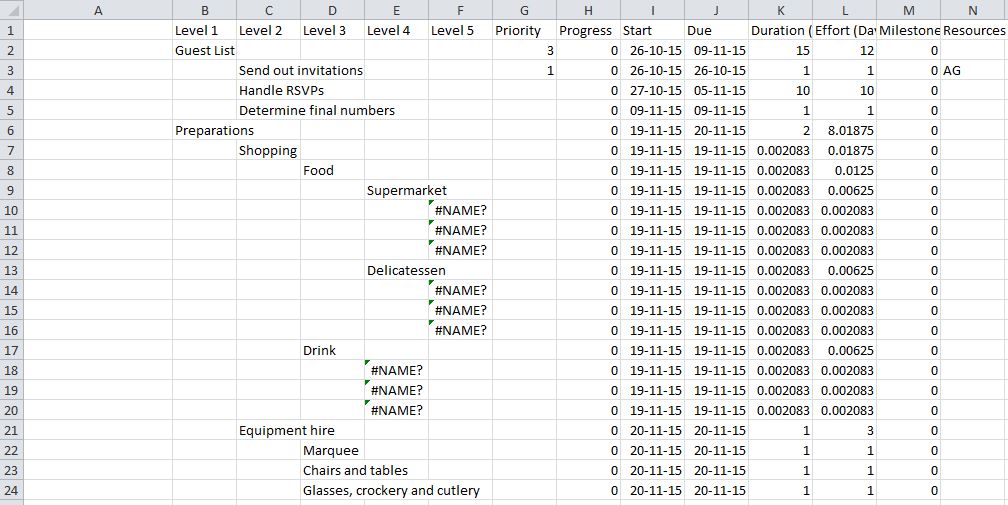
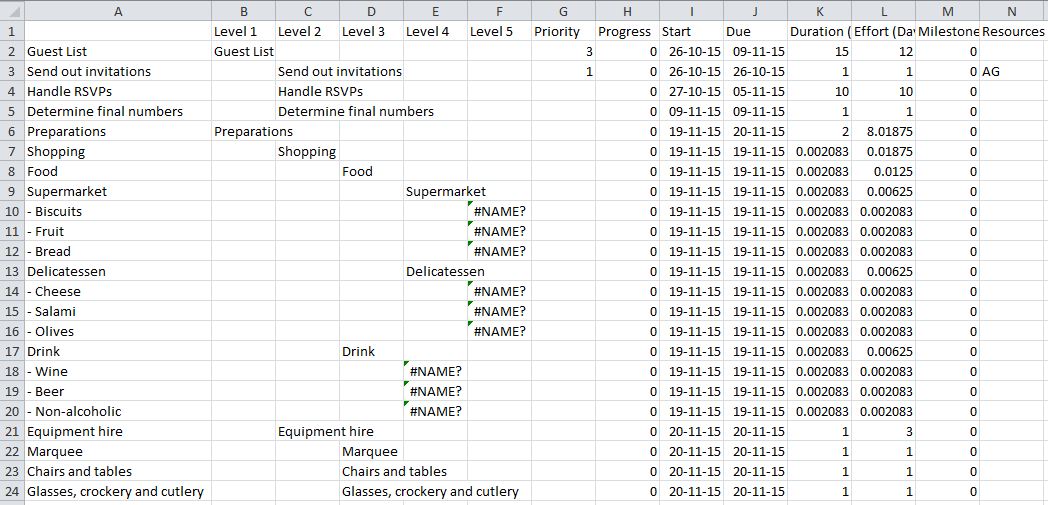
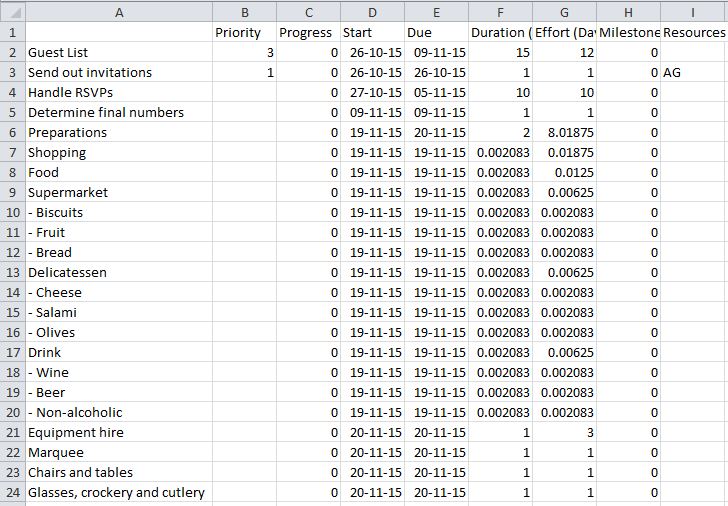
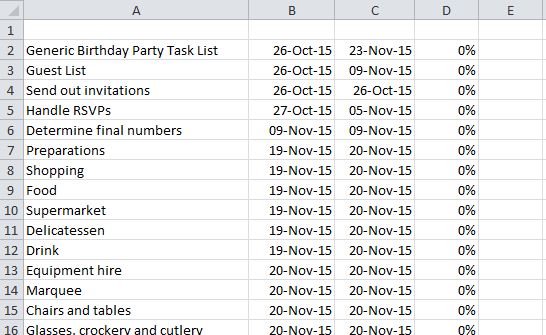
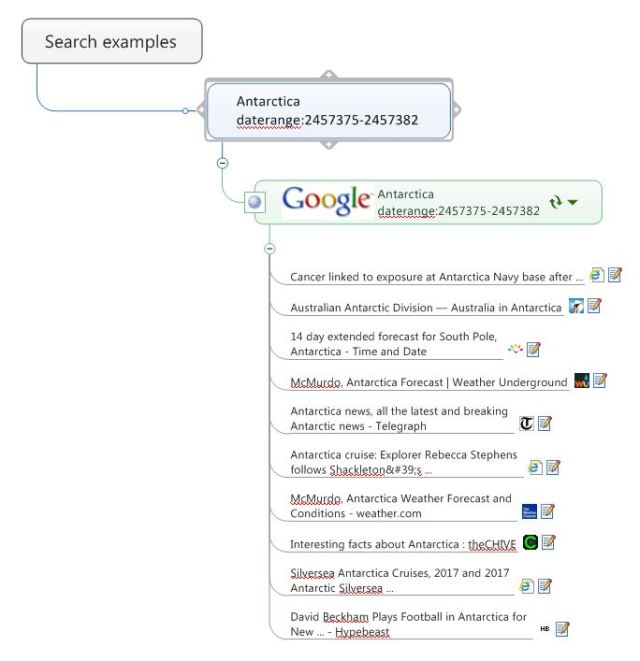
Clearly calculating the JDN is not something you are going to be able to do off the top of your head. There are online Julian to Georgian calendar converters, but the simplest and most elegant way to find out a JDN for specific date is to set up a conversion formula in a spreadsheet. Excel and most other spreadsheet programs are no strangers to date numbering; even if dates are normally presented to us in a format we understand – for example, 21-12-2015, or (in the US) 12-21-2015 – as far as Excel is concerned that date (21st December 2015) is 42359. Obviously that’s very different to the JDN for the same date, but that’s because Excel starts its numbering from 1 January 1900. The basic principle is the same, though the JDN actually starts at 12 noon rather than midnight.
Google search map part with daterange operator added
This means that it is fairly easy to convert a date in Excel into JDN numbering , assuming you have at least a basic working knowledge of Excel formulas. In fact there are instructions on how to do this on the Microsoft Office website. Scroll down to the section “Convert a date to a Julian date used in Astronomy” and you will see that if the current date is in (for example) cell A2 the formula would be =A2+2415018.50. In fact you should leave off the 0.5 because Google search isn’t terribly happy about fractions, so for 21st December 2015 the Julian Day Number is 42359+2415018=2457377. Incidentally for various reasons which I don’t fully understand the formula is valid only for dates after 01/03/1901, but this should not present a major problem.
Obviously using a spreadsheet makes it easy to apply the formula to different dates, but the real advantage is in being able to set up and change a date range easily. This can be done in two ways, either by specifying the start and end dates, or by specifying one or the other and adding or subtracting the number of days equivalent to the range you want. You can also use Excel’s TODAY function to establish the end of the date range and work backwards from there to establish the beginning date. This will automatically update every time you open the file.
The essential thing is that you end up with two dates expressed as Julian Date Numbers and formatted in a way which Google understands. This means that you have to combine text and calculation results in the Excel formula using the ampersand. Taking the example we used earlier and assuming you have the start and end dates in cells A2 and A3 respectively, the formula would be =” daterange:”&(A2+2415018)&”-“&(A3+2415018). Note the leading space before daterange.
If you like you can also put the search term into the formula as well. Assuming that you put the search term in the cell A1 the resulting complete formula would be =A1&” daterange:”&(A2+2415018)&”-“&(A3+2415018). So, if the search term in A1 is “Antarctica” and the date range is from 14 to 21 December 2015, the end result is as we saw earlier, Antarctica daterange:2457370-2457377. This result you can either copy into a topic in MindManager and then apply the Google search map part, or you can paste directly into the search map part itself.
Setting up multiple searches
This may seem like lot of trouble to go to for a one-off search, but if you need to search a lot of topics over a consistent time frame you can set up the date range, refresh the search term as required and copy each search to MindManager.
Better yet, you can set up a small table of searches over the same date range but with different search terms, copy this group and paste them in MindManager attached to the central or a main topic. Make sure they are all highlighted then apply the Google search map part to all the copied topics. You will still have to confirm each search but this is a fairly quick way to set up a bank of searches.
Bear in mind though that searching is not unlimited as Google frowns upon mass computer-generated searches. I’ve found that about a couple of hundred results spread over a maximum of 10 or a dozen searches seems to be the limit; after this Google refuses to return any more searches and even Google map parts for searches already undertaken can become disconnected from Google (the little silver ball to the left of the map part gets replaced by a question mark). If this happens, reduce the number of queries and/or the number of results to be generated, save and close the map and then reopen it. If necessary you can delete the Google map parts and reapply them to the topics which contain the search terms and date ranges.
There is one final piece to this puzzle, which is how to update the date range in the searches. MindManager makes this a little hard by not having a facility to automatically update topics or topic properties, but there is a workaround which I’ll discuss in the final step.
Step 4: Updates – how to refresh your Julian date
Given that there is no way to automatically refresh the date range within MindManager the only options to do this depend on Excel’s TODAY function. There are two alternatives – the first is to delete all the searches in the map completely and then use the steps described above coupled with the TODAY function to generate a completely fresh set of searches. This is fine if you have only one or two searches which you haven’t altered in MindManager and which are attached to the same parent topic. But what if you have edited the search terms in the map, or attached multiple searches to more than one parent topic?
The second alternative is to keep the existing searches in place and overwrite the date range with a fresh set of dates by using MindManager’s Replace function. When I say “keep the existing searches in place” I mean the parent topics containing the search term and not the attached Google map part, which this method replaces. While it is possible to edit just the Google map parts to replace the date range this means the daterange expression in the parent topic and the Google map part would be different which could cause confusion; alternatively you could replace the date range in both but this is unnecessarily complicated. On balance I think the following is the simplest approach:
- Confirm that you have saved all the search results you want to keep in a different location and then delete the Google map parts but leave their parent topics with the search terms and date ranges.
- Copy the current date range from one of these topics and call up the Replace function, then paste the date range in the Find what field. You can either copy and paste the whole daterange operator starting daterange (for example, daterange:2457370-2457377) or just the JDN part of the expression (as in 2457370-2457377); it doesn’t matter which you choose so long as you are consistent.
- Leave the Replace dialogue box open and switch to Excel and generate the new date range. Copy this using the same form of the expression you selected in step 2 (for example, one week on from the daterange example in stage 2 would be daterange:2457377-2457384or just 2457377-2457384).
- Switch back to MindManager and the Replace dialogue box. Paste the updated daterange expression in the Replace with field, and click on Replace all to update all the date ranges in the topics with search terms in the map.
- Highlight all these topics then apply the Google map part. Confirm the search on each topic to generate fresh searches.
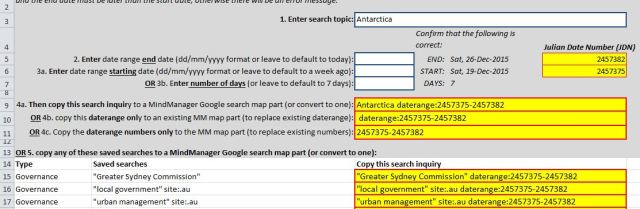
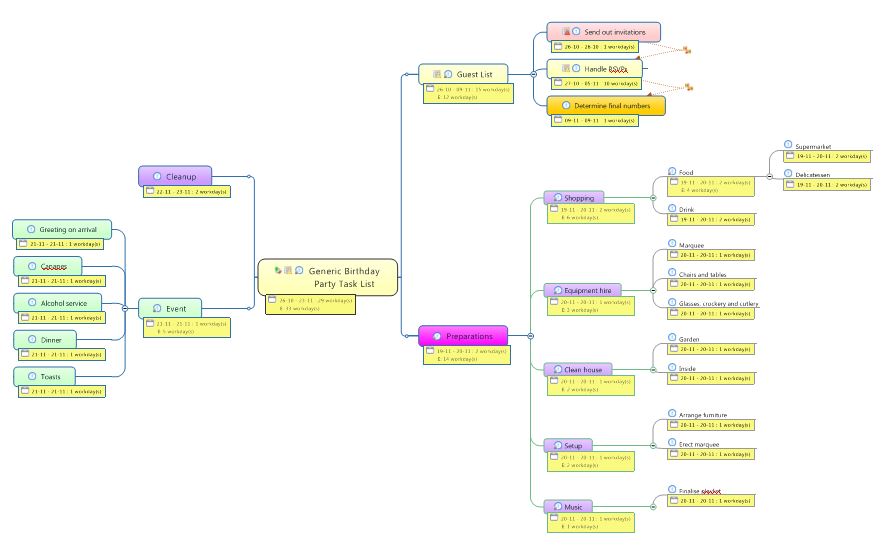
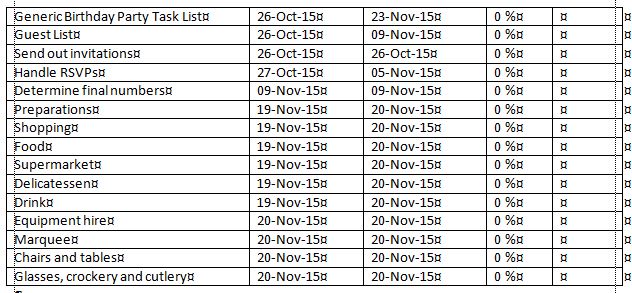
Example of an Excel Julian date converter
Conclusion: Comparing the results
This brings us to the final question – is all this effort worthwhile when you can simply use Advanced Search directly in Google, setting the date range with its Last update field and copying the results to MindManager? Any user interested in combining Google searches with mind maps has to answer that for themselves, but I think there are some benefits in being able to search directly and store the results within MindManager.
I’ve tried to make this approach a bit more practical by using Excel to create a conversion table which automatically updates and provides options to create a search term combined with the current date range (which defaults to the last seven days), or to copy just the updated daterange search operator. It also includes a table containing combinations of the date range with search terms I use a lot.
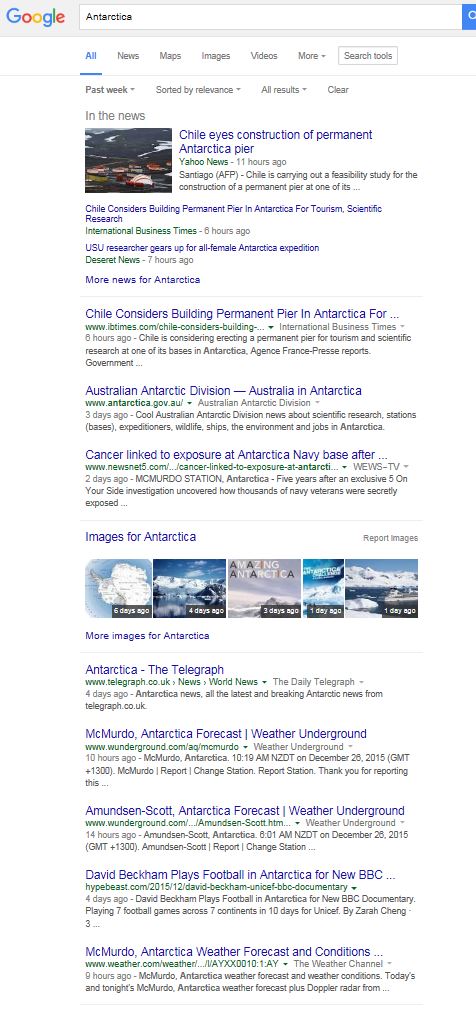
Finally, I’ve compared the results I obtained using the Google map part method and Google Advanced Search for the same period. As you can see the results are very similar, though not identical, which obviously reflects subtle differences in the way that the standard and advanced Google searches operate.
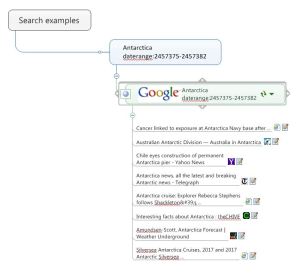
Search for Antarctica over the past seven days (to 26/12/15) using MM Google Map Part

Search for Antarctica over the past week (to 26/12/2015) using Google Advanced search