
I’m very pleased that Alludo/MindManager have added Topic Level as a SmartRules trigger in the current version of MindManager (V23), as I’ve been seeking to have access to it for a long time. While the excellent MindManager add-in MAP provides a different way to access it, I’ve always felt that the ability to use Topic Level should be part of the core product.
Topic Level is simply the level of a topic within a mind map hierarchy expressed as a number. The number increases with every level down through the map, so the central topic has a topic level of zero (more on that in a moment), main topics are level 1, and so on.
All topics at the same level share the same number. This also applies to floating topics, with the floating topic itself being zero and each descending level of subtopics increasing in number. And Topic Level isn’t static – whenever you move a topic up and down the map hierarchy or cut or copy and paste it at a different level in another part of the map the number will change to reflect the topic’s new position
At this stage Topic Level can only be used as a SmartRules trigger and not accessed directly. This is a different approach to the MAP add-in which provides facilities to select topics by level and also to add them as a topic property. Nonetheless, the ability to access Topic Level as a trigger still opens up a wide range of possibilities.
Some of these are explored in this post. Please note that to use these techniques you will need MindManager 23 or later, as well as a reasonable working knowledge of both MindManager SmartRules and formulas.
How to use topic level
The Topic Level facility relies on SmartRules. It is used as a SmartRules trigger with options to select higher, equal to, not equal to, lower than, etc, integers between 1 and 9 – in other words, from Main Topic level 1 down to level 9 in a map.
Note that you can’t select 0 for the Central Topic or for floating topics directly. However, you can choose Topic Level Is Lower Than 1 as the trigger. This will then apply the SmartRule to the Central Topic and all floating topics in the map. Similarly, Topic Level triggers for other map levels will also be applied to sub-topics at that level in any branches linked to floating topics.
Standard SmartRules practice applies, so for example if you want to select a range between two Topic Levels (say 3 and 6 inclusive) you can use two triggers in the same rule – Is Higher Than or Equal to 3, and Is Lower Than 6, with the When ALL conditions are met option selected. And of course you can combine one or more Topic Level triggers with other triggers and use these to apply the full range of SmartRule effects.
Adding or changing topic attributes by topic level
Probably the most obvious use of the Topic Level trigger is to apply a set of attributes such as topic fill, line or font colour and various font effects to topics to provide a visual indication of their level in the map.
While setting separate SmartRules for each level takes a little bit of time and effort, the outcome is set of rules which can be applied to quickly format maps. The associated advantage is that this formatting is applied automatically as topics are moved up and down within the map hierarchy, or as new topics are added. These SmartRules can also be added to the SmartRules Library for reuse on other maps.
There are many ways this can be used, including:
- Formatting new maps according to a standard set of rules.
- Applying standardised formatting quickly to imported maps regardless of how they were previously formatted.
- Developing sets of SmartRules with different formatting schemes which can be stored in the Library and applied either to new or imported maps.
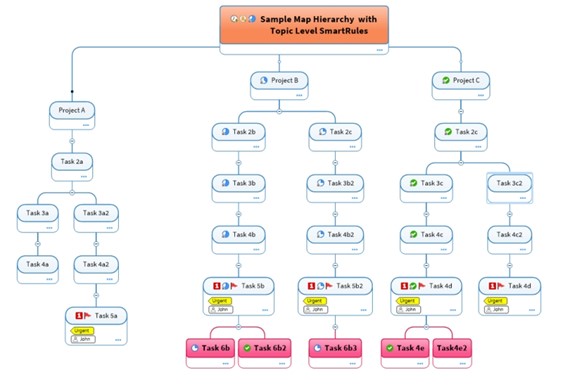
- Using formatting to highlight specific topic levels. For example, topics below a certain level could be highlighted in distinct colours to show they need priority attention (see example map below). Conversely, all topics not meeting certain criteria can be partially faded by applying muted colours to fill, lines and text.
The following example SmartRule shows how different font and topic attributes being applied to all level 5 topics in a map:

– with the following result:

Adding icons, markers or other features based on Topic Level
The SmartRules Topic Level trigger can also be used to add an icon or text marker to topics depending on their level in the map. This works the same way as applying topic attributes based on topic level, and this approach can also be used to add resources or apply a task priority or even progress level. There are several uses for this facility:
- Applying a numeric icon to make it easier to identify one or more specific levels in a map.
- Adding a task priority to specific levels. For example, tasks below a certain level may need to be identified as having a high priority.
- Adding text markers to identify specific actions that need to be undertaken in relation to topics at certain levels in a map.
- Nominating specific resources to be applied at certain topic levels. For example, either specific positions or staff members could be identified as being responsible for all tasks across a project at the same level.
- The following SmartRule applies an Urgent tag and a red flag and Priority 1 icons to all Level 5 tasks, and assigns John as the relevant resource:
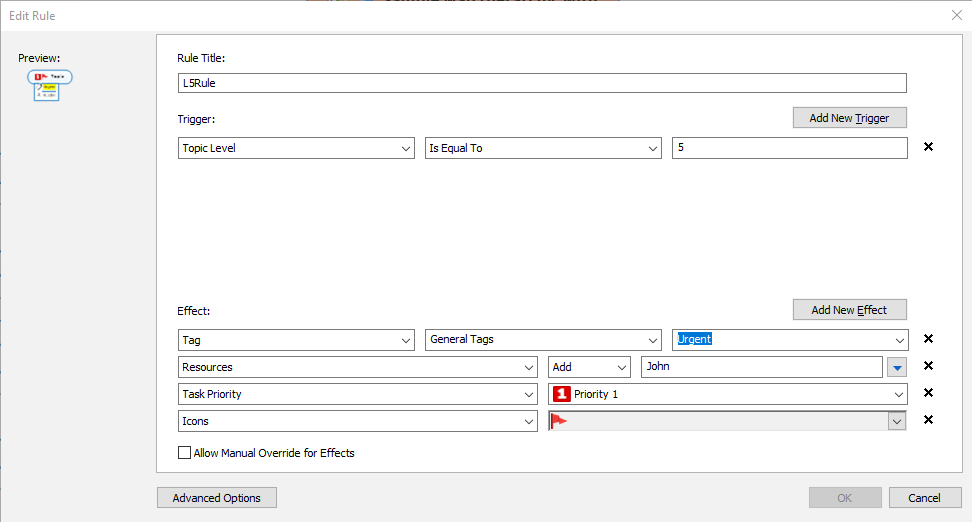
– with the results shown below:
Creating Topic Level properties to use in formulas
The Topic Level trigger can also be used in SmartRules to add topic properties which can then be used both with other SmartRules and formulas – and the combination of the two can be leveraged to achieve some powerful results. These include counting topics at specific levels, or summing other topic properties or task attributes such as general costs by level.
However, you first have to make a choice about how you will use Topic Level to add topic properties. Basically there are two approaches:
- Option A: create separate topic properties for each level with SmartRules to add a numeric entry only to the relevant property for each level.
- Option B: create a single topic property with SmartRules to apply the relevant Topic Level number (or some other numeric value based on the Topic Level trigger).
At first sight Option B looks like the simplest alternative. However, there is no easy way to count all the topics at, say, level 5 in a map based on a single Topic Number property and then show the result on the central topic. You can count all the sub-topics with a Topic Number property and you can even add them all up, but it is difficult to count just all the occurrences of a single number like “5”.
I’ll come back to a solution for this in a moment, but first I’ll discuss Option A. This involves creating separate topic properties for each level which are added to all topics and then using Topic Level triggers in a set of matching SmartRules to populate the appropriate property on each topic.
For example, if you had a simple map with just a central topic, a layer of main topics and two layers of subtopics and you wanted to count topics in all layers (except the central topic) you would create three topic properties, say:
- TL1 (main topic level)
- TL2 (subtopic level)
- TL3 (sub-subtopic level)
You also need to add three separate SmartRules. For the main topic level you would use Topic Level 1 as the trigger and the addition of “1” to the TL1 topic property as the effect. You would then do the same for the first subtopic level with the trigger being Topic Level 2 with an effect to add “1” to the TL2 topic property (note: “1”, not “2”).
You would then repeat this for the sub-subtopic level with Topic Level 3 as the trigger. Finally, you would add to the central topic a separate formula for each topic level that would either count or sum the values in all descendants.
The problem with this approach is that you need to add a full set of all the topic properties to every topic in the map, as well as creating the matching rules. This may be fine for maps with a small number of topic levels – and as far as I can tell is the only way to show a topic count for all levels in the map simultaneously – but it is time-consuming to do this for a map with eight or nine levels. In addition, each topic ends up with a large set of properties of which only one, the relevant topic level, will have an entry at any one time.
However, if you are prepared to show the count for each topic level just one at a time there is a much simpler approach based on a tweak to Option B.
An easy way to count topics by Topic Level
As I noted in the previous section, one limitation of creating a single topic property to represent Topic Level is that it is difficult to count or add specific numeric values in a single property. This is partly because MindManager formulas lack an IF THEN function which could easily be used to add only those numbers which meet the appropriate criteria.
However, MM formulas do have a simple EQUAL function “==”. This returns a numeric value of “1” if the two numbers involved are equal, and “0” if they are not.
This can be used to establish whether a variable in a property equals a specified number, or whether one variable – such as a topic’s Topic Level number property – equals another variable, in this case the topic number selected by the user.
The catch is that this test has to be applied on a topic-by-topic basis, which means you need to create a second property on each topic which is linked to this formula. When the topic property number equals the one specified by the user, this “test” property will have a value of “1”. When the two are not equal it will have a value of zero. All you then need to do is count (or sum) the number of times “1” appears in this property throughout the map to show the total number of topics at the nominated level.
Setting this up is quite straightforward:
- Create the Topic Level Property: The first thing you have to do is create a Topic Level numeric property – this can have any name, but “Topic Level” or “Level” are obvious choices. Initially, this needs to be added to only one topic. You then need a set of SmartRules to add the matching Topic Level number to this property using Topic Level as a trigger. For example, the SmartRule for level 3 topics would be as follows:
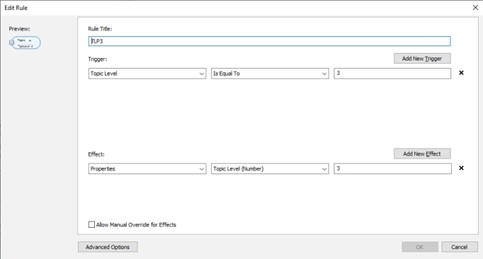
As you add the SmartRules for each level, the Topic Level property is added for that level with the appropriate level number.
- Create the reference level Topic Property: You then need to add a property to which the desired topic property number can be added for comparison to the Topic Level property for each topic. This can be added to the central topic, but a floating topic which has some advantages can be used instead. In this example this has been called SelectTopicLevel (more on the topic level selection process in a moment).
- Create the formula to test the Topic Level property against the selected reference property: In this example the following formula uses the EQUAL function to compare the Topic Level property on each topic to the SelectTopicLevel property:
[TLTrue]=[Topic Level]==topic[SelectTopicLevel]
Where [Topic Level] is the Topic Level number of topic and topic[SelectTopicLevel] points to the floating topic containing the property where the user nominates which topic level they want to count. This formula, which has to be copied and pasted in all topics, results in a “1” for every topic where the Topic Level number equals the nominated level, and “0”where the numbers don’t match.
- Count the topics which match the desired level: The formula to count (or sum – either can be used) which is added to the central topic is as follows:
[TLCount]=SUM(Descendants.[TLTrue])
You can if you wish transfer the result to the floating topic where the topic level number has been selected by adding the following formula to the floating topic:
[Topic Level Count]=topic[TLCount]
Where “topic” points to the central topic.
Incidentally adding the Topic Level property to all topics in a map provides a simple facility to count the total number of topics. The following formula added to the Central Topic counts all topics in the main map tree, or at least those to which the Topic Level property has been added, regardless of their level number:
[TLCountAll]=COUNT(Descendants.[Topic Level])
Options to nominate the desired Topic Level
The simplest way to select the reference topic level that you wish to use is to add it to the relevant topic property in the central topic or, as shown in the formula above, in a specific floating topic.
However, this approach isn’t very user-friendly. A more accessible alternative is to allow users to nominate a topic level with an icon or text marker and then use a SmartRule to add the corresponding level number to the reference topic property.
In the map shown above MindManager’s blue 0 to 6 number icons are used to select the topic level on the floating Topic Level Selector topic (in this case topic level 1). You can then use SmartRules to write the corresponding topic level number in the relevant property in the same floating topic, as shown in the following example:

Obviously using the same icon set for other purposes in the same map should be avoided, but given MindManager provides several sets of numbered icons this shouldn’t be an issue. As noted earlier tags could also be used but icons provide a more elegant solution.
Summing or counting other numeric topic properties by Topic Level
As well as formatting and counting topics that belong to a specific topic level, the topic level trigger can also be used to count, total or apply arithmetic functions involving other numeric topic properties as well as task attributes. This is a little bit more complicated in part because there is no way to use topic level to select other properties directly.
However, there is a workaround. If we apply the [TLTrue]=[Topic Level]==topic[SelectTopicLevel] formula mentioned earlier to add a “1” to the TLTrue property in every topic where the Topic Level number equals the nominated level, this can be used to multiply other numeric topic properties or task attributes to create another topic property. So, taking General Cost as example, we can multiply the TLTrue property by the GeneralCost task attribute, as follows:
[TLTruecost]=[TLTrue]*GeneralCost
In this formula TLTruecost will be equal to the task attribute General Cost only in those topics where the TLTrue test returns a “1”, ie, where the topic level equals the selected number. At all other levels the TLTrue property will equal zero, so the TLTruecost will also be zero. This can then be used as the basis for a number of calculations:
- Total: It is easy to sum the TLTruecost property at the Central topic level with the following formula:
[TLTruecostTotal]=SUM(Descendants.[TLTruecost]
Since the only topics where the TLTruecost property is more than zero are those at the relevant topic level, these are the only ones that will be totalled
- Average: Once the total has been calculated, finding the average is straightforward. All you have to do is divide the total by the count of topics at the relevant level which is derived using the formula described earlier, so:
[TLCount]=SUM(Descendants.[TLTrue]) followed by:[TLTruecostAvg]=[TLTruecostTotal]/[TLCount]
- Maximum: The process of finding the maximum value at a specific topic level is also straightforward, as again only topics at the selected level will have a TLTruecost value above zero. Therefore the MAX function can be used, as shown in the following formula:
[TLTruecostMax]=MAX(Descendants.[TLTruecost]
Unfortunately, finding minimum values is a lot more complicated. This is because the formulas based on the Descendants topic range apply to all descendants, not just those at the selected topic level. The preceding formulas simply multiply out the unwanted topic level values by zero and the wanted ones by one; this means there will be multiple topics outside the selected topic level where the relevant property has a value of zero, so the MIN function has a wide range of topics to chose from. As yet, I have not been able to figure out how to force the MIN function to only look at the minimum values in the selected topic level.
- Proportion of Project Total: The proportion of the overall total for any level is easy to calculate with the following formula:
[Totalcost Proportion]=[TLTruecostTotal]/GeneralCost
Please note however that at the Main Topic and other higher levels in the map this is likely to be 100%
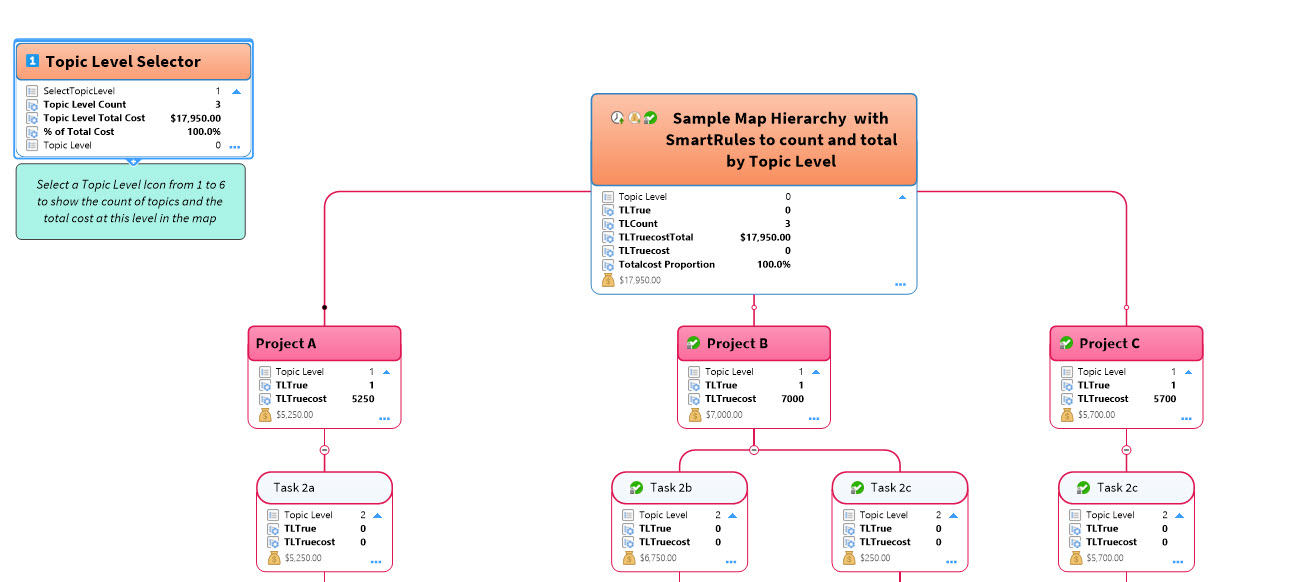
The following image shows a map which incorporates all these techniques as well as the formulas relating to the Central Topic:
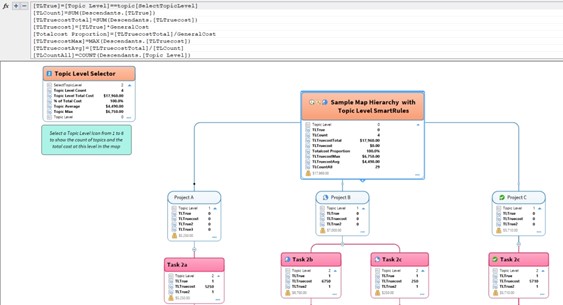
The following image shows the Topic Level Selector floating topic in more detail along with the associated formulas:
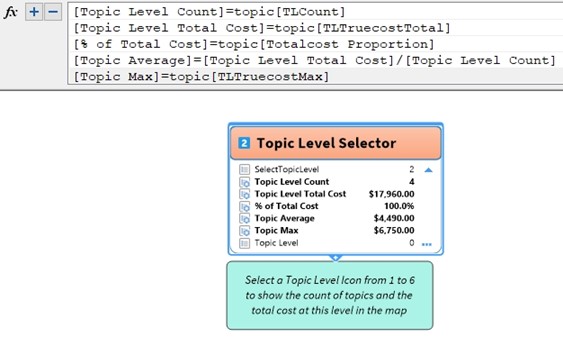
The numeric icon on the Topic Level Selector allows users to nominate the topic level as discussed earlier, while this topic acts as a dashboard with links back to the Central Topic to show the topic level count, total cost at the cost level, the average for the topic level and the maximum cost.
Filtering and selecting by topic level
While topics can’t be filtered or selected by topic level the topic level property can be used for this purpose. Once the property has been added it can be used in the Power Filter in the same way as any other topic property or attribute.
Matching topics can be selected and highlighted while non-matching topics can be faded or hidden, or vice versa, as shown in the following example:
Multiple topic level criteria can be used, and matching topics can also be faded or hidden.
One note of caution is that sometimes applying a filter to fade or hide non-matching topics doesn’t seem to work, but this appears to be either an intermittent bug or a setting issue.
Using topic level with other triggers
As a final note, topic level can be combined with other triggers to provide quite detailed analysis of maps both through SmartRules or Power Filters. I won’t list all the options here, but to skim the surface:
- Combining Topic Level and Topic Belongs to Branch to highlight topics at specific levels branch-by-branch.
- Highlighting Topics at specific level where the topic costs which are above or below a nominated amount
- Using Topic Level with Resource to show which member of staff is responsible for tasks at specified levels.

Pingback: Sociamind MindManager Article Guide Updated | Sociamind
Thank you for this Alex. I think it would be fair to point out the elephant in the room here 🙂
This feature, like the template style feature, applies to maps with a regular structure. A “regular” structure is a hierarchy where the topic level has an explicit and understandable meaning. Examples include Org charts, WBS maps, well-formatted data, and documents based on an outline structure. Applying visual effects to everything at the same level highlights a membership or equivalence shared by these topics.
But this does not apply to irregular maps, which make up a significant proportion of use cases: project plans, specifications, learning resources, brainstorms, presentations, or analyses. Here the topic level itself does not represent anything; topics at any level can be members of important groupings. The value of a hierarchy is just as important in these maps, and the ability to draw free-form irregular hierarchies at scale is one of the USPs of mind mapping software. Routinely applying style by topic level (as the map templates do) adds disinformation rather than information, which we then need to learn to ignore. This undermines rather than helps with visualisation.
It is often better to set up a neutral template style where topics at all levels have the same style. This frees up the actual topic style to carry useful visual information. In these cases, the topic level itself is unlikely to be useful in automatically applying effects.
LikeLike
Hi Nick,
Thanks for your thoughtful reply.
I agree that using topic level to systematically format maps by adding attributes such as fill colour, font colour etc is useful in only a limited number of cases and works only when you have what you call “regular” maps.
However, as I indicated in the post, this is only one potential use. Users may simply want a visual indicator such as icon to indicate the location of a topic within the hierarchy, or they may be allocating resources by level. Topic level can also be used to sum costs by level or to find average costs etc.
I think this points to a third area of use which sits between regular, structured maps and the more irregular ones you describe. This is using maps as an analytical tool. I have used maps extensively to analyse qualitative data such as surveys, interview transcripts etc where often you are in a sense trying to create order out of chaos.
This is an iterative process – you start off with a map loosely based on the interview or survey questions and then develop tags to represent key themes or issues as you read through the initial responses. You then in turn apply these tags to further responses while still adding to the set of tags. Often you may also change the structure of the map as you go, ordering it in quite a different way to what you started with.
At the end of the process hopefully you have a map with multiple sets of tags identifying the key issues and how often they were raised. You can also do simple analyses to see what trends apply across the responses to different questions. I haven’t done this for a while and SmartRules weren’t around then but I imagine you could even apply tags automatically based on topic text once you have developed the initial set of markers.
I know there is dedicated software to do this but it is expensive and way more complex than what I need. I am also aware that topic level numbering is not perhaps as useful as some other SmartRule triggers, but I still think it has potential (for example I am working on how to identify the lowest level topic in each branch across a large map, regardless of what level that is).
At the end of the day the topic level trigger is just another MindManager tool. One of my admittedly nerdish hobbies is pushing these tools as far as they can go, working out how they work and what they can do, and then sharing the techniques and identifying potential uses. It’s ultimately up to people to figure out whether and how these tools are useful for them.
Alex
LikeLiked by 1 person