
While there are numerous options for exporting MindManager maps to Word, Excel, PowerPoint and other destinations, one thing the program lacks is an easy way to print or export a simple table or to-do list of tasks with just four or five columns – a column combining main topics and tasks for example, and one each for start and due dates, and duration and progress.
This is a particular problem if you want to create such a list based on a complex map. If you have a fairly “flat” map with not too many main tasks or rollups and with all the tasks at the same topic level, then exporting to Excel and creating such a task list is reasonably straightforward. If however you have a map with multiple levels and rollups and in particular with tasks occurring at different levels, things can get very messy.
I’ve created this hypothetical party planning map to demonstrate some of the issues involved and how they may be resolved (I’m using MindManager 16 for this but the problem and approach should be similar for all recent versions):
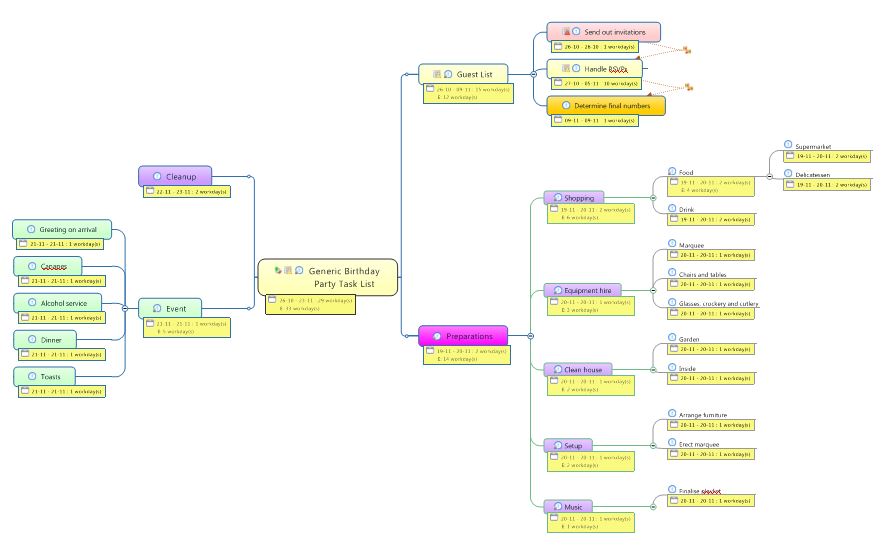
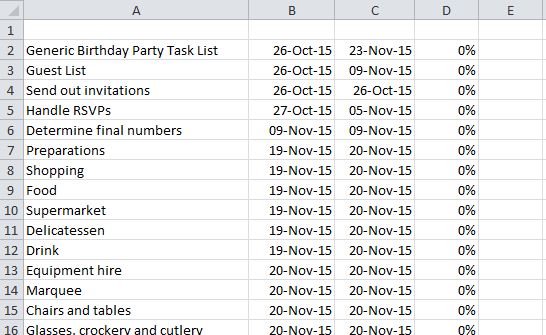
When this map is exported to Excel with the task information included it ends up looking like this:

While the task info such as start and due dates all end up in the same column, the main topics appear in the first column separate from the tasks themselves which are distributed across the columns representing the three different levels in the map.
This obviously makes sense for a lot of purposes but is not ideal for a simple task list. You can try to collapse the multiple columns with the actual tasks and main topics into a single column, but doing so by simply moving tasks to the first column can result in the task info getting out of whack. I’m sure a macro could be created in Excel to automate this process while maintaining the task information columns, but not everyone can write macros.
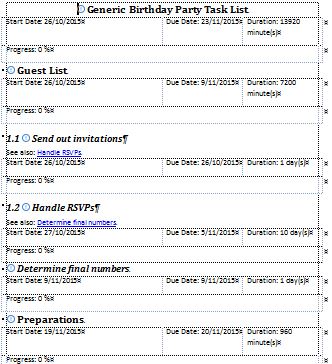
Exporting to Word with the task information results in something which looks even more divorced from a simple task list. The tasks appear as headings at various levels and the task info as one-row tables under the task heading they refer to, as the following document exported from the above map demonstrates:
Again it may be possible to turn this into a simple list but this seems to require even more work than converting the Excel file, so I started to look at alternatives. My first point of call was the Outline view, but this does not include any task information. There is however another starting point, which already looks very much like the task list I want; the summary table of tasks and task information in the Gantt view, as shown in this snip of the Gantt chart from the party planning map:

While this is close in format to the list I want, how you export it isn’t immediately obvious though it is relatively simple. All you need to do is maximise the Gantt chart so that all of the section you want of the Gantt table is visible (I’ll come back to this in a moment), highlight all the topics and subtopics you want to appear as well as the columns you need and then copy them.
There are however a couple of catches. The most important is that the selecting, highlighting and copying must be done in the Gantt chart table and not on the map itself. If you highlight topics in the map view a similar area will also be highlighted in the Gantt view, but if you click in the Gantt table area to copy it, only the information relating to the final topic will actually be copied. In addition there is no point in right-clicking after selecting the area in the Gantt table to be copied, as the context menu does not include the copy command; you have to use either the copy command in the ribbon or its equivalent in the QAT:
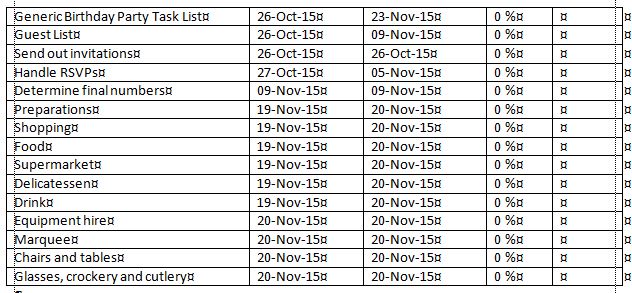
Once you have copied the portion of the Gantt table you want, simply switch to Excel or Word and paste it. In Excel the material copied will appear as a simple table with all the topics and tasks included in a single column. You will need to widen the columns after which you can format the new table as you wish, though remember that the dates appear as text rather than date numbers and will need to be converted if you wish to use them in calculations:
In Word the information is pasted as rows, with each item separated by tabs. To turn this into a table, simply select Convert Text to Table and nominate the tabs to become the column delimiters. As with Excel you can now adjust column widths and format the table to appear the way you want:
There is one final catch with this approach. I mentioned earlier that the Gantt chart needed to be maximised so that all of the table or at least the portion you want to copy is visible, but obviously some maps will always be bigger than the Gantt window. The problem with this is that there seems to be no way to scroll down while copying from the Gantt table. Edit: it turns out that all you need to do is highlight a row then press Shift and the Down Arrow key to highlight the area you want even if it extends beyond the bottom of the visible page. See the addendum for more details.
There are two workarounds. The first is simply to copy the visible section then paste this in Word or Excel before scrolling down and repeating the copying process with the next section. The second is a little more complicated but means that you can copy the entire map in one go.
First you collapse the Gantt table so that only the main topics are visible, then select all the collapsed main topics. Now expand the map and all of it including all subtopics and tasks should be highlighted and can be copied, with one annoying exception – if the last main topic in the map has sub-topic tasks, none of these will be selected. The simplest way to overcome this is to create a dummy final main topic with no subtopics and format it as a task with start and due date information (the latter preferably beyond the final date of the the actual tasks in the map). This dummy topic will “protect” the subtopics of the preceding main topic and can be deleted from the Excel or Word document that you export to.
Limitations:
There is no easy way to distinguish main topics or other topic levels once they are combined in a single column in the exported document. The easiest way to do this is to capitalise or manually number them in the map before exporting.
The other main limitation is that only basic task information is exported – start and due dates, progress and resources. While this is probably enough for most basic purposes it would be helpful if other features such as task priority or even topic notes could be exported as well.
The main limitation is the slightly clumsy way all this has to be done. While it is not terribly complicated, Mindjet should make it a good deal easier to export from the Gantt chart. It would be even better if such a “flat” table option could be made available in the export/share menu.
In my follow-up post I describe some additional techniques and ideas on how to use this process.

Great process.
I have my extended monitor above my laptop monitor. Stretching the application window to cover both monitors will allow to me to access more tasks in one copy. I use UltraMon to do this for me at the touch of a button on any window. http://www.realtimesoft.com/ultramon/
LikeLike
Thanks Andrew for the feedback. Extending the application over two monitors vertically is a great idea. I’ve also posted a follow-up article with some extra ideas on how to use the Gantt table copying process and I’ve also suggested to Nigel that he have a look at incorporating this feature in some way in a future version of MAP.
LikeLike
Pingback: Follow-up to exporting a simple table or to-do list from MindManager | Sociamind
Pingback: Addendum to exporting a simple task or to-do list from MindManager | Sociamind
Pingback: What happened in Sociamind in 2015? | Sociamind
Pingback: Sending tasks from Word to MindManager (with a little help from Excel) | Sociamind
Pingback: MindManager Shortcuts: 6 –Import and Export Options (part 1: Microsoft Word) | Sociamind