
I’ve been exploring the process I described in my last post to produce simple to-do lists or task tables from MindManager maps by copying the Gantt chart table and then pasting it in Excel or Word. But first, a clarification in relation to that process – if you want the main and intermediate level topics in the map to appear in these task lists, they have to be visible in the Gantt chart table. This means that either they have to be formatted as tasks or, preferably, that the task information is rolled up to them or through them to the central topic.
Now to describe some of the extra techniques and ideas I’ve come up with in relation to the process (again, based on MindManager 16 but mostly applicable to all recent versions):
Filtering to produce tailored lists. You can filter the map and then click on the Show Filter in Gantt Chart button to mirror the results in the Gantt chart table before copying it to Word or Excel. As well as the start and due dates, task progress or resources which are displayed in the Gantt chart you can also filter on things which don’t appear there, like task priority. This approach would be particularly useful for printing tailored daily task lists for individual staff members involved in major projects, especially those working in situations where they don’t have access to MindManager or to electronic task lists on computers, smartphones or tablets.
Producing an itemised shopping or equipment list. As noted above, one limitation of using the Gantt chart table is that it displays only those topics in the map which incorporate task information. It also does not display topic notes. This means that if you want to include, say, a shopping list or itemised inventory of equipment, these also have to be turned into tasks. The problem is that doing this can distort task info rollup process and it also make it difficult to distinguish the list from the rest of the “real” tasks.
A partial solution is to turn these items into tasks but make them only one minute each in duration. To distinguish them from actual tasks you could also put a dash or similar character at the start of each list item (see following examples).


The table containing these list items can be pasted in Word without any problem but to avoid an error message in Excel (which assumes these characters are mathematical symbols) the first column of the portion of the spreadsheet where you are pasting the table should be formatted as text rather than general. The following shows the table in Word:

Combining the Gantt table copying approach with MindManager exporting/sharing. While I devised the Gantt-based method mainly to produce simple task lists, the results do reflect the limited number of items shown in the Gantt table. While this is quite adequate for most purposes there are times when it would be useful to be able to include some of the omitted items such as priority, duration, effort or topic properties. In addition when exporting to Excel the Start and Due Date columns are in text rather than date format and need to be converted if any date-based calculations are needed.
If the map is relatively flat you can simply use the export to CSV facility which incorporates most of these items and edit the resulting file in Excel. If however you have a lot of tasks at different levels which you want to appear in a single list but still also include items such as priority, duration or date formatting without doing too much editing you can combine the simple task list approach with the standard export process. This involves the following steps:
1. Export a CSV file from MindManager after filtering the map if required. Select Outline in the Export to Spreadsheet (CSV) Settings.
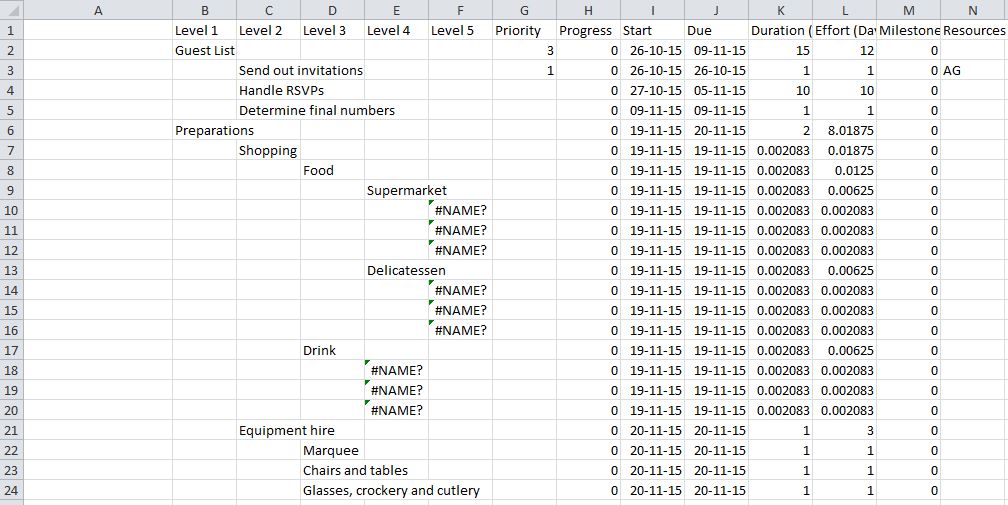
2. Open the file in Excel and insert a column to the left of the exported table. If you have list items in the Gantt table which are preceded by a dash or other mathematical symbol format the column you have just inserted in the Excel spreadsheet as text (it’s probably wise to save the file at this point). The spreadsheet should look something like this:
3. Return to MindManager, open up the Gantt table and select the range of topics and tasks you wish to copy using the process described in the last post. Ensure however that you highlight and copy only the first column.
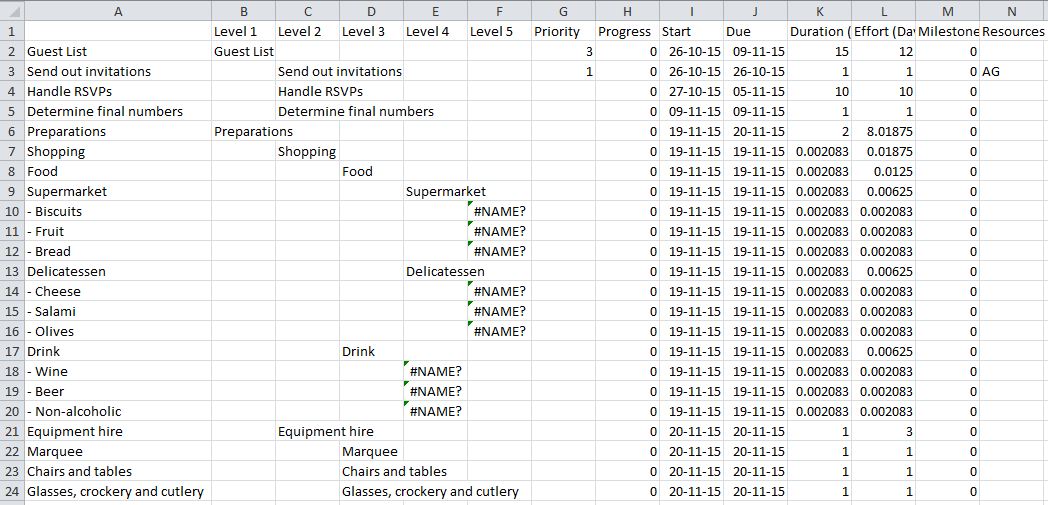
4. Switch back to Excel and paste the copied set of topics and tasks in the blank column you inserted in step 2. It should be easy to check against the previously-exported table whether the topics and tasks line up appropriately:
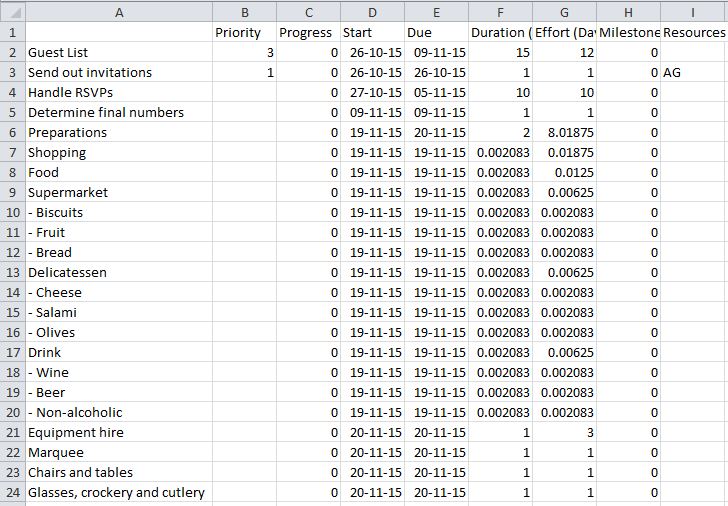
5. Once you have the first column correctly positioned, delete all the columns relating to the different map levels that came in the table imported from MindManager. The single column that was pasted in the preceding step should now be immediately to the left of the Progress and other task information-related columns. The table should now look like this, with the Start and Due Date columns automatically formatted as dates:
6. Edit and format the file as required and save again. If you want the file to appear as a Word table, follow these steps in Excel then copy the table to Word.
Creating an alternative “hybrid” view of the Gantt chart. The process of creating and printing the Gantt view in a MindManager map has very limited options and it is difficult to get the results to look the way you want. Simply taking and printing a snip of the Gantt page can sometimes produce better results but in some respects has even more limitations.
One alternative is to create a hybrid view incorporating the text list view with a snip of just the Gantt chart itself. This requires a degree of trial and error, but also has the advantage that the text in the table can be formatted and both this table and the Gantt image resized independently of each other. To do this requires the following steps:
- Set up a page in Word with the margins and orientation you want – most likely, landscape with narrow margins – and then insert a single row table with only two cells.
- Go to the map in MindManager and copy the Gantt chart table (or the relevant section of the table), then return to Word and paste it in the first cell. If possible limit the amount pasted so that it can stay on one page.
- Using the techniques described previously convert the pasted material to a table, so effectively you have a table within a table.
- Return to the map and take a snip of the relevant section of the chart (without the table). Make sure the range in the chart being copied exactly matches the range in the Gantt chart table copied in step 2.
- Paste the resulting image in the second cell of the table. The you will need to resize the image and experiment with the size of the text, the width of the cells etc until the topics and tasks in the table align with the Gantt chart bars.
- Format the table as you see fit and if you wish add a heading. The result should look something like this:


Pingback: Exporting a simple task table or to-do list from MindManager | Sociamind
Pingback: What happened in Sociamind in 2015? | Sociamind