
Update: Recently I published a series of articles covering the import of a range of material from Word, outlining some techniques which update the methods discussed below. Part A looks at the import of standard (non-table based) Word documents, Part B specifically covers the topic discussed below – the import of non-task tables (and Excel spreadsheets) – while Part C describes how to import tables and spreadsheets containing task lists.
In an earlier post I described a method using Word heading styles to import spreadsheets and tables such as directory listings and catalogues via a Word table to create hierarchical MindManager (MM) maps with multiple levels. Subsequently I developed an alternative approach using Excel pivotables which I first outlined on the Mindjet website forum, but I thought I would post an updated version outlining both methods.
Part of the problem with importing directory listings, catalogues and similar spreadsheets into MindManager (MM) is actually at the Excel end. These tables are sometimes “flat” with no hierarchical information or alternatively they involve repetition of the higher-order elements mostly in the first column or two; for example, a set of entries for an organisation’s workforce will involve the department and/or section name being repeated for each person in that section, usually in the first column or two.
Faced with tables like this, MM has no way of knowing when each section begins or ends; it needs some sort of outline structure, Word heading styles or a combination of both for the import process to be able to work out which items are main topics, sub-topics, sub-subtopics etc. In effect the methods I proposed in my previous post suggested two ways around this problem – edit the spreadsheet to look more like an outline, or alternatively import it first to Word, adjust the table and apply Word heading styles.
Previously I had looked at Excel’s pivotable feature but I didn’t think it would be able to create an outline to match MM’s requirements without a lot of work, given its primary focus on statistical analysis. After a closer inspection it turns out happily that I was wrong; in fact, pivotables are probably the easiest way to turn a directory-style table with hierarchical data (in either Excel or Word) into a map.
Whether you use the pivotable approach or the method I described earlier depends a lot on what the table looks like to begin with as well as what you are trying to do with it. Here are the two main approaches, based on Excel and Word 2010 and MM v15 (the instructions are similar for recent versions of either program):
Option 1:
If the table is completely flat with no hierarchical information (or if it contains hierarchical information you don’t require to be displayed) then the method outlined in my earlier post (which was based on an approach first described by Andrew Wilcox in his Applications of MindManager blog) is probably the best option:
- If the table is in Excel, copy and paste it into Word. If you are copying the material from a table on a web page, remove any excess text (including duplicate carriage returns) using search and paste and then delete any columns you don’t need.
- Apply Word’s inbuilt heading styles to each column in cascading order left to right; ie, heading 1 style to the first column, heading 2 to the second column and so on (turn off any heading numbering in the styles).
- if you want some of the information to appear in the topic notes the last column(s) can be left in normal or any non-heading format, though bear in mind that they will appear in the notes as a table. Once you have edited it the Word table might look something like the following, depending on your heading styles, and is ready to be sent to MM:

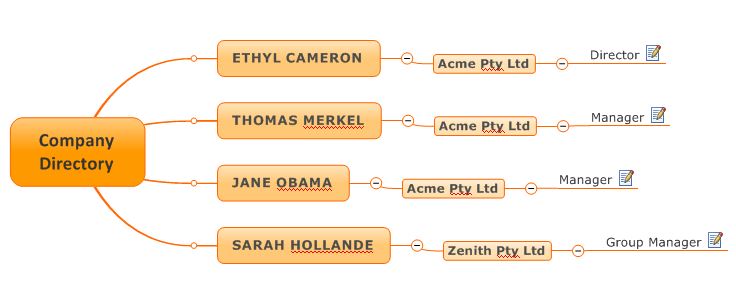
- Highlight all the required rows (without the header row) then press the MindManager button on the Word ribbon to export to MM (do not copy and paste). The data in any column which does not have a heading style (such as the phone numbers in this example) will be treated as topic notes, so the above table ends up looking like this as a MM map, with one branch per table row (I’ve made this right-facing to save space):


Option 2
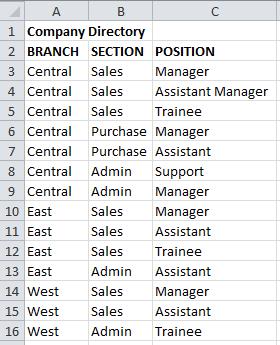
If your table contains hierarchical data that you want to be reflected in the map you can manually construct an outline table which was the method I described previously or use the Excel pivotable approach, which is a lot easier. We’ll start off with something like this:
- If the table is in Word, copy and paste it to Excel (the opposite of of option 1). Then arrange the columns in descending hierarchical order, left to right. In this example the highest level is branch, followed by section. Then sort the rows in the same heirarchical order.
- While this method can handle unsorted data, sorting makes it easier to check that the cells to be grouped are identical, which is essential to form the hierarchy required for the map. First ensure that there are no blank cells or incosistent spacing and then check everything is spelt and punctuated consistently. The table should now look like this:

- In the Insert tab on the ribbon, go to Tables and click on the button to create a pivotable, either on this worksheet or another one, using your table as the source.
- When the PivoTable Table Field List appears tick all the fields to add to the pivotable as row labels in the order that they appear in the first table. The pivotable should now appear, along with the Pivotable ribbon.
- Highlight the pivotable, click on pivotable options on the ribbon and then again on Options. When the PivoTable Options dialogue box appears, click on the Totals and Filters tab and untick the boxes under Grand Totals. The pivotable should look like this:

- Click on the first entry in the first field (in this case, “Central”); the Active Field tab on the PivoTable Tools ribbon should now displaying the relevant field (in this case, “Branch”). Click on Field Settings and when the dialogue box appears, click on the Subtotals and Filters tab and select None under Subtotals. Then go to the Layout and Print tab, select Show items in outline form and untick the Display labels form the next field and Display subtotals boxes.
- Repeat step 6 for the first entry in each of the other fields. The pivotable should now be a proper outline table which looks like this:

- Highlight all of the pivotable except the header row, switch to a new map in MM and paste the pivotable (do not use the export to MM button, again the opposite of the first option). The resulting map should look like this (I’ve renamed the central topic manually and changed the layout to right map again):

- Unlike the previous method there is no way to specify that the lowest level(s) should be formatted as topic notes. However if you have Olympic Linited’s MAP add-in you can apply the Sub-Topics to Notes option on a topic-by-topic basis once the map has been created.


Uses and limitations
Both options are best suited to creating maps of tables containing descriptive rather than statistical information, for example to create organisation charts from company personnel lists or visual representations of catalogue lists or tables in documents , for example a table of recommendations in a report. As noted earlier the source table should be well structured.
Neither approach is ideal for importing a table of tasks, as everything is turned into a topic; they also don’t provide a facility to import data such as task due dates or resourcing information. For an alternative template-based approach, have a look at Cain Hill’s post here. Cain’s model is based on using Freemind but probably could be adapted for MindManager.

Pingback: What happened in Sociamind in 2015? | Sociamind
Pingback: Sending tasks from Word to MindManager (with a little help from Excel) | Sociamind
Pingback: The Ins and Outs of MindManager Word Importing – Part B: tables | Sociamind