Like my previous post on how to show the degree that tasks in a MindManager project map are “On Track”, this article was prompted by a query on the MindManager Community Forum.
In this case the question was whether it is possible to highlight parent topics based on the specific attributes of sub-tasks; for example, whether any of these sub-tasks are yet to begin, if they are falling behind schedule or whether they have (or don’t have) other characteristics. The answer is a qualified yes – it is possible to show at the parent topic level if one or more of its sub-tasks meet certain criteria, but not how many sub-tasks are involved, nor which ones they are. However even this information can be very useful, especially when a map is collapsed so that individual tasks can’t be seen.
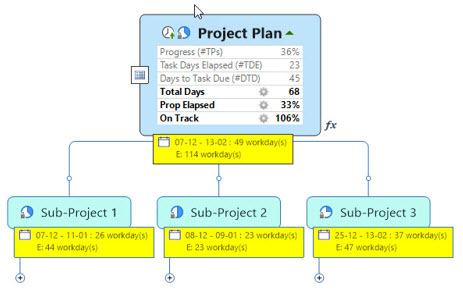
In the following example I’m going to demonstrate how to do this with the On-Track status I discussed in the last post. However, the technique can be used with a range of task information items (for example, progress) as well as with any topic properties created by the user. As with the previous article you will need MindManager 2018 and if you are intending to use On-Track status you will also need the MAP add-in from Olympic Limited and to have set up the On-Track formulae and extended properties using the techniques I described in the previous post.First, consider the following hypothetical project plan. This is similar to the one I used in the On Track example, but the tasks have been organised into three sub-projects:
With an example this small and fully expanded map it is fairly easy to see which tasks are falling behind, based on the conditional formatting. However, if the map is collapsed to the main topic level, this information is no longer available:
It is possible to reference the properties of other topics in a topic using a calculated property containing a formula which selects a topic range and applies an appropriate built-in function. Topic ranges are expressed relative to the position of the topic in the map hierarchy – for example, the topic’s “Parents”, “Ancestors”, “Siblings”, “Children” or “Descendants”. In this map I’m using Descendants – all the subtopics of the sub-project topic.
The built-in functions include Sum, Average, Count, Min and Max. I’m using Min – the smallest value of the specific topic property within the Descendants range – and applying it to the On Track Extended Property as created using MAP. This is because I’m specifically concerned with tasks that are falling behind schedule.
In order to show this information at the sub-project level, we need to create a calculated topic property based on the following formula:
[Schedule]=MIN(Descendants[On Track])
I’ve formatted this as a percentage and added it to each of the sub-project topics. This means the Schedule property in the sub-project topics will show the value of the lowest On Track property in the tasks attached to that sub-project – in other words, the task that is the furthest behind.
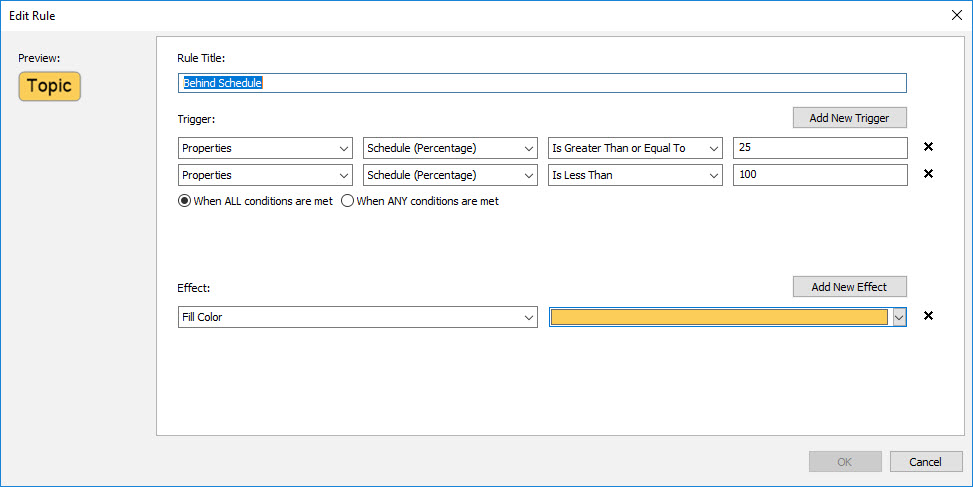
I’ve then added two conditional formatting rules applied specifically to the calculated Schedule topic property, as shown below. These use similar formatting as for the tasks themselves to show if the furthest-behind task is only 25% on track or less (ie, if the most-behind task is more than 75% behind schedule) and those that are behind but up to 25% on track. You can of course use different criteria and apply different effects:

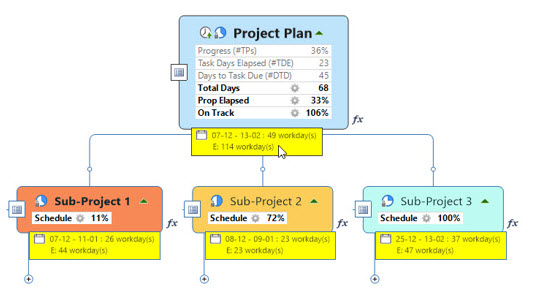
The map should now look like this:

The real value of this approach emerges when the map is collapsed to the main topic/sub-project level. It becomes clear for example that Sub-Project 1 has at least one project that is very behind schedule, and Sub-Project 2 has a task that is not so severely behind schedule, even if you can’t see the sub-topics themselves:
As with the previous On Track example you can add a legend to the map to explain the sub-task conditional formatting which can be consistent with the individual task conditional formatting.
