
Update: since posting the first version of this article I discovered that the MAP add-in Extended Properties feature which this approach relies on counts task days differently to MindManager. I’ve developed a workaround which is incorporated into this updated version.
I was prompted to write this article by a query on the Mindjet Community Forum about whether it was possible in MindManager to highlight which tasks in a project are “On Track” – in other words, those tasks in which the proportion of each task completed matches the time elapsed since the task began.
MM actually already has a very simple version of showing lagging tasks in the form of the at-risk and past-due indicators. The at-risk indicator is applied when a task duration is more than 75% elapsed but progress is less than 75%, while the past due indicator appears when the due date has lapsed but the task is incomplete.
Neither of these addresses the broader issue of showing tasks which are either lagging or ahead of schedule at other times – or indeed those tasks which are exactly on track. In my response to the query on the Mindjet forum I provided a brief example of how all this could be done using several new features in MM2018 and critically, a couple of functions in the MM MAP add-in.
In this post I’ll describe in more detail how this approach can be developed and how the resulting information can be displayed in a variety of ways. More broadly this example demonstrates the extent to which the powerful new features in MM2018 and the MAP add-in can be integrated to provide additional tools for information analysis and presentation.
Obviously you will need both MM2018 and the latest version of MAP which can be obtained from Olympic Limited. I’ll be using the following hypothetical project plan.
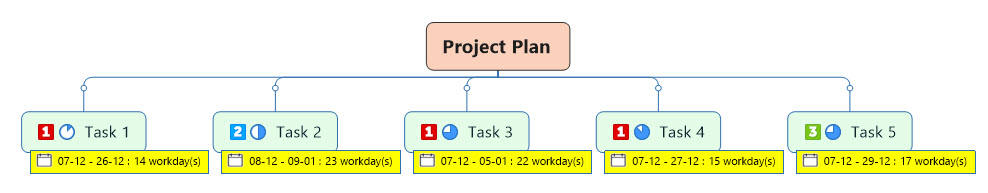
Hypothetical Project Plan
Getting Task Info into Topic Properties
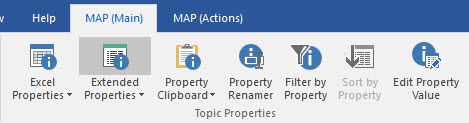
The first step is getting relevant task information into the task’s topic properties so that a number of formulae can be used compare and analyse the data. This is the crucial role of the MAP add-in.
One of MAP’s many functions is Extended Properties. Found in the Topic Properties tab, the Extended Properties command allows users to copy task information into topic properties. This includes all the standard task info properties like priority, Start date, Due date etc, but also calculated ones like Days to Task Start, Days to Task Due and Task Days Elapsed. Once these properties are created they remain in sync with the task information and timing.
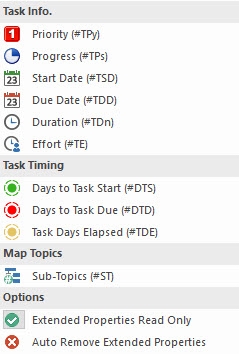 The three properties we are particularly interested in are Progress (#TPs), Task Days Elapsed (#TDE) and Days to Task Due(#DTE).
Note: In the original version of this article I was attempting to compare Task Days Elapsed to Duration but unfortunately these are counted differently – Duration in MindManager is based on counting workdays only whereas all the MAP extended properties are based on counts of all days. The two are directly comparable only if every day is a workday and there are no holidays. In this version On Track status is therefore based entirely on calculations using the MAP extended properties’ counts of all days – not as accurate as performing the calculations on workdays only, but still a useful measure.
As the MAP help notes, once extended properties have been added to a topic they can be toggled on and off by left-clicking the top section of the Extended Properties command. When enabled the command will become “lit” and MAP will “try and auto-calculate any Extended Properties used in the Map” and update them as task info is amended or updated.

Creating Calculated Topic Properties
The measurement of whether a task is on track – and if it isn’t, the extent to which it is lagging or ahead of schedule – is the relationship between the proportion of the task completed to the proportion of the time allocated to the task at the time the assessment of progress is being made.
This can be expressed as the following formula:
[On Track]=[Progress]/[Proportion Time Elapsed]
If the two measures are equal – say, 50% of the task is completed and the time elapsed is half the planned total duration between the task start and due dates – the task is on track and will therefore the answer will be 1 (or 100%) if expressed as a percentage).
On the other hand, if only 25% of the task has been completed in the same period the answer would be 0.5, or 50%. If 75% of the task had been completed the answer would be 1.5 or 150%.
There are a few steps to be taken before we can put this formula in place. The first of these is to put some calculated topic properties in place using the Define Topic Properties command and then add the related formulae.
While there are several options (including incorporating all the calculations in a single formula) I’ve selected the following to better demonstrate the process:
- [Total Days]. Given the difficulties with comparing the differing approaches of MM and the MAP add-in in counting task days, we will need to be consistent and use MAP’s approach of counting all days by adding the days elapsed to the days left until the task is due. The resulting formula is: [Total Days]= [Task Days Elapsed (#TDE)]+[Days to Task Due (#DTD)]
- [Prop Elapsed]. The second topic property is establish the proportion of the days elapsed since the task’s start date of the task’s total days. This property should be formatted as a percentage and the formula is: [Prop Elapsed]=[Task Days Elapsed (#TDE)]/[Total Days]
- [On Track]. The final topic property will express the final formula as discussed earlier. This should also be formatted as a percentage. The formula is: [On Track]=[Progress (#TPs)]/[Prop Elapsed]

After you have created the formula test the topic with a variety of options for progress and duration. Remember that duration is locked to the start and due dates. Also, the MAP add-in assumes that the Task Days Elapsed topic property is “live” only if the task is current (i.e., the due date is after the current date).
Setting up Conditional Formatting
After creating and testing the calculated topic properties and the associated formulas the next step is to set up some rules in Conditional Formatting to highlight each state.
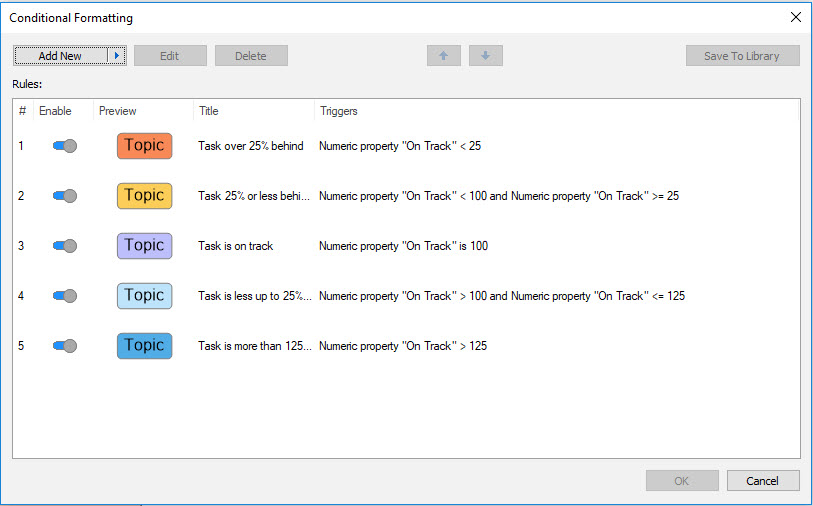
In this example I’ve set up five rules to provide a visual scale of whether tasks are on track and if not how far in advance or behind they are:
- Over 25% behind
- Up to 25% behind
- On track
- Up to 25% ahead
- Over 25% ahead
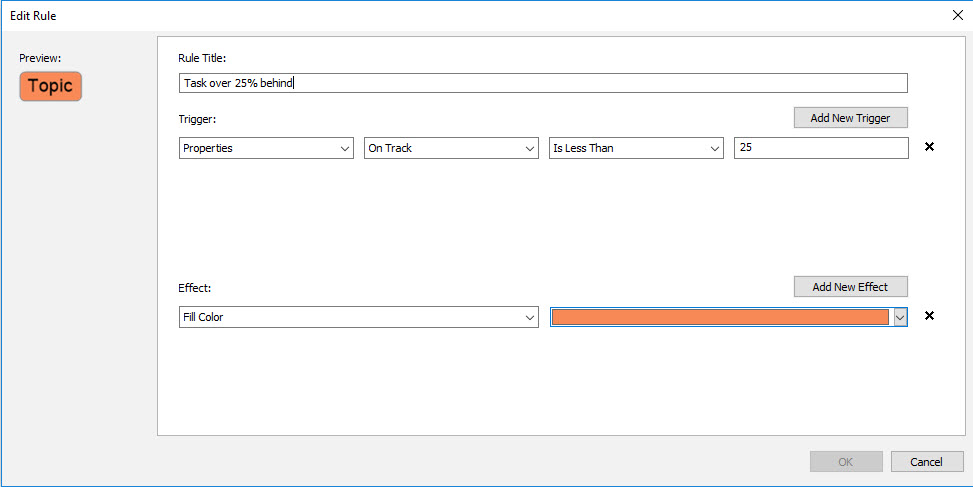
Conditional Formatting can be found in the Dashboards section of the Advanced tab on the ribbon. I won’t go into too much detail on how to establish Conditional Formatting rules as the MindManager help file is reasonably detailed on this topic and you also need to experiment to get the outcomes which best suits your purpose, but each rule needs three things:
- A title;
- One or more Triggers (in this case the relationship of the On Track field to each of the specific criteria listed above); and
- One or more Effects (i.e., what will change in relation to the topic’s appearance if it meets the criteria). There is a wide range of topic attributes to choose from and in my example I have selected fill colour and where the task is more than 25% behind schedule I have also made the topic title bold (note: the bold effect is only available in MM version 2018.1.154 and higher).
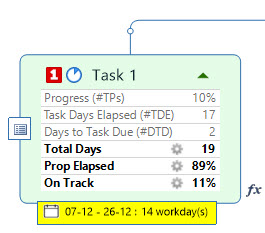
 Rules can also be saved to a library from which they can be added to other maps. In addition if you have enough topics in the map to show all the criteria at once via conditional formatting this should be reflected in the Fill Colors section of the Marker Index. This can then be pasted in the map as a legend (don’t forget that if you do this topics the legend itself will be listed and counted in the Marker Index). Here is the example topic with the calculated topic properties and the conditional formatting rule for tasks tracking over 25% behind displayed.
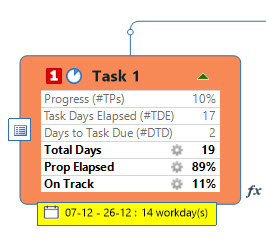
After setting up the rules you need to test them with various levels of completion in the On Track field to see if the effects change as they should.
Viewing and Filtering the Results
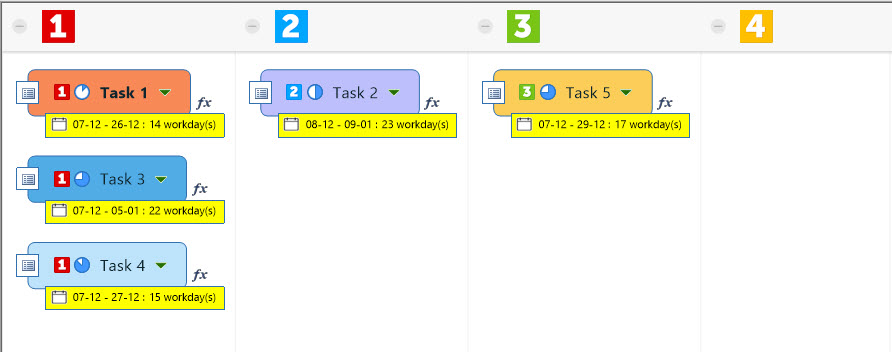
The resulting project plan should now look like this:

In many cases Conditional Formatting may provide sufficient information, especially if it is combined with a legend but there may be times when you want to look at On track performance in relation to other criteria and/or to highlight the performance of specific tasks, for example those that have fallen more than 25% behind.
MM 2018 provides a number of tools to assist with this. The first examples are the Priority and Schedule Views which group the tasks according to priority and date. Using Priority View is particularly effective for highlighting high-priority tasks which may be falling behind:
The second is filtering. This of course is not new to MM 2018, but the latest version features SmartFade. This highlights selected topics while the rest of the map is faded out which makes the map much easier to read. While the whole of the map is shown the filtered topics are easy to spot and now you can see them in context.

In future posts I’ll explore some other ways in which the new features of MindManager 2018 can be used together and in combination with add-ins such as MAP. In the meantime a Happy Christmas to Sociamind readers and all the best for 2018.

Pingback: Getting On Track with MindManager 2018 – part 2: tracking in sub-project roll-ups | Sociamind