Using MindManager dashboard maps with Outlook: part 4

Having described how to sync MindManager (MM) tasks with Outlook and then how this relationship could be used to create an interactive dashboard as well as some of the limitations and issues involved in this approach in my earlier posts, I’ll conclude by highlighting some of the potential uses for MM dashboard maps.

First, a general comment on the range of people who may find this method useful, and those who may not. Unfortunately the limitations I outlined in part 3 are likely to rule out those users working in team environments because of the difficulties involved in assigning resources to tasks. As I noted, any resource created and assigned in an MM project map is summarily removed by the process of syncing with Outlook. While task assignments made in Outlook are retained they are visible but not editable in MM; in theory it would be possible to manage resources from Outlook, but this is a fairly convoluted approach.

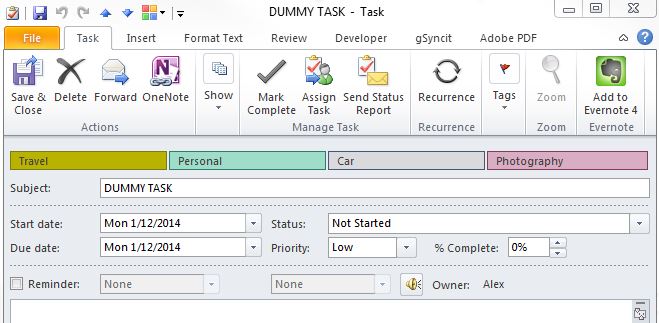
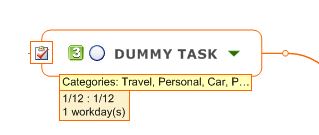
Those users who rely on multiple text tag groups in their maps are also ruled out, as again these groups are summarily stripped out by the syncing process to be replaced by an Outlook-compatible categories group. Similarly, topic properties defined in MM are overwritten by an Outlook-defined status property. Both of these are editable from within MM, but can’t be deleted or replaced. And it isn’t possible to work around these limitations by using icons or labels as proxies either – while these aren’t removed from the source maps, they aren’t synced to Outlook and the dashboard maps.

Users wanting to create dashboard maps without these limitations are probably better off purchasing a dedicated add-in designed for this purpose. The two main contenders are Gyronix ResultsManager (US$297) or Olympic Limited’s TopicTracker (UK£49). Both these programs can create dashboard maps but in different ways. To quote their respective websites, ResultsManager “sweeps maps looking for incomplete activities, and dynamically creates focused dashboards designed to support action and review processes”, while TopicTracker “gives you a way to share specific Topics from your Mindjet MindManager Maps with other Topic Tracker users, allowing them to be kept informed of changes to specific Topic elements when required”.

These are both excellent add-ins but they are expensive (especially ResultsManager) and as I noted in my first post may be overkill for many users. If you currently don’t use features such as resource allocation, multiple text tag groups or topic properties or can at least live without them – for example, if you are managing multiple projects using MM in a single-licence environment– then the Outlook-based model I have outlined may be helpful. This process is not too complicated and it’s also free, provided you already have Microsoft Outlook. Here are some potential uses:

Potential uses of MindManager Dashboard Maps

Potential uses of MindManager Dashboard Maps


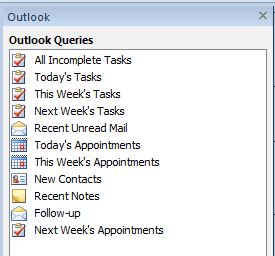
  1. Creating an interactive snapshot of current task deadlines across multiple projects. This is the most obvious use of dashboard maps and is particularly effective if you use assign a category to each project or major sub-project as outlined in my example. You could create a daily or weekly snapshot of current tasks and then update progress, which after syncing will be incorporated in the original project maps. If task roll-up is turned on in your dashboard map you will also get a visual warning about what tasks are at risk or overdue.
  2. Prepare an overview of what’s coming up – or what’s already been completed. Similarly you can look at what’s due next week, in the next two weeks or next month – or you can specific any date range from the current date or within a set range in the future. This approach is great for managing your upcoming workload, which will also be visible in the Gantt chart. As well as reviewing what has to be done, you can also look at which projects have been completed in, say, the previous 10 days.
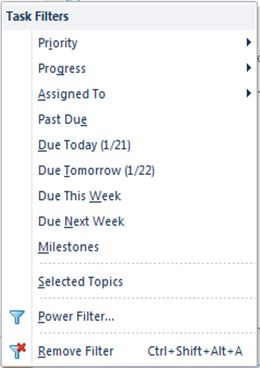
  3. Review selected categories/projects or tasks with specific priorities or other attributes. As I indicated in my previous post, Outlook queries allow you only to select all categories or only one. There is however a way around this; use a power filter in the dashboard map. You can filter on the basis of categories, or on the basis of any other task topic attribute, for example priority, specific progress level or the presence or otherwise of topic notes or attachments (all attributes which are maintained through the syncing process).
  4. Prepare and maintain a detailed management map for a single project which incorporates non-task items. While the process I have outlined in this series of posts has concentrated on creating dashboard maps involving tasks, don’t forget that emails, appointments, contacts and even notes in Outlook can also be incorporated. Of these, only tasks and appointments can be initiated from the MM side, but all items can be sent from Outlook to MM and synced (with varying degrees of success). This provides the opportunity to create a complete project management map as a dashboard separate from the initial planning map, with links to these Outlook items as well as to documents and working files. While it is possible to do this with more than one project category in the same map, this approach is best reserved for providing a detailed overview of a single project. Don’t forget however that some topic attributes are item-specific, so if you apply a power filter to show, for example, task due dates or progress status, all non-task items in the map will be hidden.

Obviously there are many other potential uses for dashboard maps, which I’ll leave you to explore. I’ll conclude this series with a minor correction to my previous posts explaining the process, but one that opens up further opportunities. I stated that the categories which underpin this approach could only be created in Outlook and then sent to MM via a dummy task, where they could be applied to topics before syncing. This strictly speaking isn’t the case; while the first category must be created in Outlook, once syncing is undertaken further categories can be added in MM. The dummy task is still needed to send them back to Outlook, which is also the only place where category colours can be added, but this means that you brainstorm your categories in MM first.

Posted in Mind Mapping, Project Management | Tagged , | 1 Comment

Using MindManager dashboard maps with Outlook: part 3

In my previous posts I covered how to sync MindManager (MM) tasks with Outlook and then how to use this relationship to create an interactive dashboard which can provide a basic snapshot of progress across multiple projects and maps. Once you understand the basic techniques involved you can use dashboard maps in a variety of ways (which I’ll explore in the final part of this series), but first it’s important to realise that there are some major limitations and issues to be aware of.

1. The need to get the syncing sequence right. It’s important that categories are created in Outlook first then sent to your project planning maps in MM, then tasks are sent from MM to Outlook before categories are applied to them in MM (or Outlook) and the tasks are then re-synced. Only then can the dashboard maps are created.

2. Not everything can be synced between the same tasks in MM and Outlook. Once tasks have been synced the following task elements are synced also and therefore will appear in the original project map, Outlook and the dashboard map. These can also be edited in the original project map, the dashboard map or in Outlook, though some need to be initiated in Outlook, as indicated:

  1. Topic text, though care must be taken when doing this especially from within the dashboard map to ensure you don’t create “orphan” topics.
  2. Categories and category colours, but in MM the colour is displayed when only one category is applied to the task and may be overridden by MM’s At Risk and Past Due topic colours. Categories must be initiated within Outlook rather than MM but can be modified in either program.
  3. Task priority, though Outlook recognises only three levels, high medium and low; anything below that is regarded as low and will appear in a dashboard map as a 3, while still retaining the original value in the source planning map.
  4. Task progress, as a percentage.
  5. Task start and due dates. Duration is not shown in Outlook but is separately calculated from these dates in both the original and the dashboard maps.
  6. Task status. This is shown as a topic property and is initiated from Outlook, though it can be modified in either program from a drop-down menu.
  7. Topic notes.
  8. Attachments. These will appear in the Outlook topic notes and after syncing in the MM topic notes as well as remaining as attachments. They will appear in dashboard maps provided

The following task elements are not synced with either Outlook or the dashboard map, but are retained in the original project map:

  1. Any flags, icons etc (other than those showing priority and progress, which are synced).
  2. Topic colouring except where this is associated with a category in which case it will be synced (though these may be overridden by MM’s At Risk and Past Due topic colours).
  3. Topic numbering.
  4. Topic labels.
  5. Images inserted into the topic.
  6. Hyperlinks.
  7. Subtopics.
  8. Callouts.
  9. Task effort.

The following task elements are not only not synced with either Outlook or the dashboard maps, they are actually removed from MM maps by the syncing process:

  1. Topic properties – in fact, if any have been defined for the topic these have to be deleted before the topic will sync with Outlook, after which Status is applied and retained as a topic property.
  2. General tags, or tags created within any user-defined tag group other than the Categories group imported from Outlook.
  3. Resources added from MM – indeed, once a task is synced, it becomes impossible to even add a resource to the same topic in MM. However, MM will show as a resource (but not allow you to edit) the email of an assignee if the task has been assigned to someone in MM.

For obvious reasons the last two are the most serious limitations. Resources can only be managed from the Outlook end and it is not possible to have any MM text tag in a synced map apart from those used for categories. Worse still, if any a map has been set up with either resource allocation or general or user-defined tags in MM, these will be summarily removed by the syncing process.

3. Creating too many dashboard maps can cause problems. There is a risk that the syncing process can become corrupted; it’s definitely a good idea to avoid dashboard maps based on other dashboard maps as this will end up duplicating tasks in Outlook and result in confusion.

4. Over- editing tasks in dashboard maps could make them “orphans”. Similar to the point above, there is a risk that making too many changes to individual topics in a dashboard map could result in them becoming “orphaned” from their original project planning maps. Dashboard maps are best suited to managing project progress and status, with other changes being made in the planning maps.

5. There are limitations in using MM’s Outlook Queries…. While Outlook queries offer a lot of options when you are setting up dashboard maps in MM, there are some limitations. Probably the most annoying is that while tasks can be sorted by start date, end date or priority it is not possible to restrict the list to only those tasks that fall due within the date range without using the filtering method I have described. Similarly while it is possible to set a date range relative to the current date (for example, the next – or the last – 10 days) and fixed date ranges, it is not possible to set a future relative range such as the week after next. Another minor quibble is that while you can select any one category or query on all categories and group by them, you cannot select, say, three or four categories only.

Outlook query list

MindManager Outlook Queries, showing pre-set query list

Task filter list

MindManager Task Filters, showing list of pre-set filters

6. …and Power Filtering. While MM’s Power Filters are quite powerful and the ability to use them with Outlook queries in MM offers great flexibility, there are still some limitations. On the plus side there is a much wider range of topic items you can filter on and while the options for filtering tasks by date are similar to those offered in the Outlook Query filter there are some interesting additions, like the next two weeks and the next month. However there is still no opportunity to set a future relative date range. I won’t go into the other complexities of filtering here but it is important to remember that unlike Outlook Queries which can be added individually or separately to a map but in isolation from each other, multiple Power Filters can also be applied but they work cumulatively and more importantly affect the whole of the map. This means, for example, that if a filter relating specifically to tasks is run, any query relating to another Outlook item such as email will not appear in the filtered map.

7. Task roll-up information and the Gant charts in dashboard maps are useful but can be misleading. If category grouping is applied to an Outlook Query in a dashboard map, the categories may appear as main topics and task roll-up information will be applied at this level. Note that this behaviour is a little erratic – in my previous post I said they always appear but that is not always the case, though roll-ups can easily be added.  It’s important to note however that the roll-up icons on categories in dashboard maps relate solely to the items displayed in that map and don’t present the total picture for each project. To complicate matters further, power filtering does not change the roll-up icons in dashboard maps for those categories which are still displayed. There are similar issues with Gantt charts, which may show the full duration of projects which run through and beyond the Outlook Query period but only those tasks which fall within this period.

In the next and final post I’ll outline some of the potential uses of this approach.

Posted in Mind Mapping, Project Management | Tagged , , | 2 Comments

Using MindManager dashboard maps with Outlook: part 2

In the previous post I demonstrated how MindManager (MM) tasks could be integrated with Outlook categories when tasks are synced between the two programs. In this article I’ll show how a single dashboard map can be created to provide a snapshot of progress across multiple projects by using MM in combination with Outlook and how once this map is created you can also use it as a “one stop shop” to update progress across a number of separate project maps. As with part one, this approach is best suited to MM users who have had some experience in using MM as well as Outlook. A copy of the PC desktop version of MM from version 9.2 onwards and Outlook 2007 onwards are required and you need to have established that these programs can sync with each other. The following process also assumes that you have set up one of more project maps and that you have linked the tasks in these to Outlook using the process I described in the first post.

Sample project planning map based on the instructions in part 1, synced to Outlook and with Outlook categories applied

Sample project planning map based on the instructions in part 1, synced to Outlook and with Outlook categories applied

  1. Set up a new blank map in MindManager (MM) and insert an Outlook query. Go to the Advanced tab and click on the Outlook items under Queries. A list of query options should appear; we’ll start with This Week’s Tasks. Click on this and all the tasks that have been synced from your project maps and which are active this week should appear as sub-topics grouped under main topics representing their categories and in most cases coloured appropriately (I’ll come back to this in a moment) under a single main topic with the name of the query and which has the query icon.
  2. Choose a map layout and edit the query. The map layout is a matter of personal choice but I think an org chart works best with dashboard maps (you may have to apply the map style to both the central topic and the query separately before the map formats properly). Now click on the query icon in the main topic; the Outlook Query dialogue box will appear. If you have followed step one the fields for Query Name (This Week’s Tasks), Folder (Tasks) etc should be filled in. The things you should check are the Sort by field (ensure this has Due date showing), the maximum number of results (the default is 30 but you might want to increase this) and that Category is set to Any and the Group topics by category box is ticked. When you click on OK the query should update and may change depending on what parameters you have entered.
    Query dialogue box

    Query dialogue box

    Dashboard map based on a This Week's Tasks query applied to the sample map. Note that those tasks that fall outside of this week are not shown

    Dashboard map based on a This Week’s Tasks query applied to the sample map. Note that those tasks that fall outside of this week are not shown

  3. Filter the map. Despite choosing to sort the dashboard map by the due date in the previous step, you will notice that the map shows tasks which fall due both during and after this week, which is a little confusing. What the query is actually selecting are the tasks which are current for this week, which includes tasks that are due this week, tasks which commence this week and tasks which run through this week, all sorted by the due date. If you want to show only the tasks which fall due this week you need to take one more step, which is to filter the map using a Power Filter. To do this, click on the Power Filter button, click on Power Filter in the menu and then click on Task Info in the menu that appears. Starting and Ending fields should then appear – leave Starting and the other fields blank but click on the drop-down arrow next to Ending. Choose This Week from the list that appears, then click on Filter and click on Show Matching Topics. The dashboard map should then show just the tasks which are due this week. You can save this query for later use and to remove it just click on the Remove Filter button.

    The dashboard map, filtered to show only those tasks due this week. Note that those items not actually due this week have now been filtered out.

    The dashboard map, filtered to show only those tasks due this week. Note that the “Walk 30 minutes” task which was not actually due this week has now been filtered out.

  4. Review the dashboard. The dashboard map should now be ready for review, showing just the incomplete tasks that are due this week, grouped as subtopics by category. You might expect the category colour also to be displayed both for these subtopics and the parent main topics, but one interesting aspect of maps prepared from Outlook queries is that MM’s Task Roll-up is applied automatically at the category level, whether or not it was used in the parent maps. As a consequence two things happen; first, task roll-up icons appear on the category main topics (more on that in a future post) and second some of the tasks themselves, as well as the category main topics, will be highlighted with MM’s past-due and at risk task colours as selected under the Calendar & Display Options. These colours override the category colours.
  5. Update task status and re-sync the dashboard map. You can now update the proportion of progress made on each task. To transfer this to the project maps you will need to resync the dashboard map back to Outlook and then in turn sync the project maps with Outlook. To start this process, click on the Microsoft Outlook Query icon on the central topic in the dashboard map and then select Sync query topics with Outlook. Also confirm that the Power Filter has been retained – if not, reapply it. When the sync and filter processes are completed the updated status should also be reflected in Outlook and in turn should appear in the project maps when you sync Outlook with them. If a task is ticked as 100% complete then it will disappear from the This Week’s Tasks map entirely. Importantly, when the calendar rolls over into a new week and you update the dashboard map, it should reflect the new week’s tasks

In my next post I’ll discuss some of the other interesting things you can do with these dashboard maps, as well as their limitations. For now, please bear in mind that dashboard maps are designed primarily to review and update task progress and that if you are planning any major changes these should be made in the main project maps.

Posted in Mind Mapping, Project Management | Tagged , | 4 Comments

Using MindManager dashboard maps with Outlook: part 1

Do you use MindManager, and have you always wanted to have one map to rule all the other ones? This series of posts outlines an approach that can be used to provide such a map, or at least one that would give you the opportunity to review other maps and make minor changes to them. 

Recently Andrew Wilcox posted a great MindManager map on his Cabre Applications of MindManager blog which provides a comprehensive overview the many ways in which MindManager (MM) can be used to manage tasks. As he states and as the map demonstrates, MM offers “so many options and add ins” to achieve this as a stand-alone program as well as in combination with other members of the Mindjet “family” or in conjunction with external programs including Microsoft Outlook.

One option that MM does lack is the capacity to set up a single dashboard map that can give you a snapshot of progress across all your projects, an issue that’s caused some lively debate recently on the Mindjet forum. This is because MM does not have an internal database of tasks from which such a dashboard could be created and in the absence of such a beast, MM’s file structure makes it difficult for a mindmap to be used to survey status across other maps.

The most obvious alternative is to use an add-in like ResultsManager, from Gyronix, which provides such a database, but while this is a very powerful tool it is fairly expensive and may be overkill for many users. There is another way, however, which is free if you already have a copy of Outlook; this is to exploit MindManager’s capacity to synchronise tasks (and other items) between the two programs. In effect, Outlook tasks are used to form a database of MM tasks.

Here’s the first stage of a process I have developed that will allow you to do this. Not only that, once the dashboard map is created you can also use it to update progress in the individual project maps without touching Outlook (though you can certainly use Outlook to do this as well).

This approach probably isn’t suitable for MM users who are complete novices, but while it is a little fiddly it really isn’t all that difficult. As well as a copy of the PC desktop version of MM from version 9.2 onwards you will need Outlook 2007 onwards and to have established that these programs can talk to each other. If you are not a regular user of Outlook you should have a play with it as well, particularly with Outlook tasks and the process to assign specific categories to them, but as I said you don’t need to interact with Outlook once the maps are set up (provided MM can talk to it).

In stage 1 I’ll outline how to link your MindManager project maps with Outlook and in particular how to apply Outlook categories to the tasks in these maps. I’m using MM15 and Outlook 2010, but the steps are similar in any recent version of both programs:

  1. Create your project maps in MindManager incorporating all the tasks involved. You should know how to do this; make sure that all tasks you create have been given start and due dates, a priority level and the progress symbol is set to 0% (or whatever proportion has been completed to date).
  2. Work out a system of categories – but don’t apply them to the tasks in your maps just yet. For various reasons – mainly the change in the method of syncing tasks between MM and Outlook introduced in version 9 of MM – categories first created in MM are simply not recognised in Outlook. You can sync tasks either way between the programs, but for categories to be recognised at both ends and kept in sync they must be first created in Outlook and then sent to MM.
  3. Set up a dummy task in Outlook as a basis for assigning categories and category colours. In Outlook create a dummy task with an obvious name and a date that’s well outside the likely date range of your actual project tasks. The purpose of this dummy task is to act as a transport so that the categories can be imported into each MM project planning map from Outlook. Then click on the categorise button under the Home tab on the ribbon and add your list of categories, assigning colours to them as you go. The resulting list of category tags should contain all the categories you want to use across all your maps. How to approach categorisation is up to you, but for the rest of this guide I’ll assume you are setting up categories and colours based on projects or sub-projects.

    Dummy task created in Outlook to transfer categories to MindManager

    Dummy task created in Outlook to transfer categories to MindManager

  4. Send the dummy task(s) to the relevant MindManager map(s). Open up the project planning map in MM and click on either the central or main topic. Return to Outlook, select the dummy topic and click on the Send to MindManager button. If this process is successful the dummy topic should appear in the map, along with each of the categories listed under a separate “Categories” tag group in MM, which is available on the Map Index tab. You may have to sync the dummy task again for this to occur, but once the Categories list appears this task’s work is done and you can delete it from the map (but retain a copy in Outlook in case you need to repeat the process). You can sort the Categories group in MM but don’t change the name of the group. If you want you can repeat this process with several dummy tasks each specific to a particular map and assigned a subset of the categories relevant to the specific map.
    Dummy task as it appears in MindManager

    Dummy task as it appears in MindManager

    Categories tag group in MindManager

    Categories tag group in MindManager

  5. Send the MM tasks to Outlook from each map before you assign categories to them. You can send each task individually or as a group; if the process has been successful each task should now have an icon in your map indicating it is now a “Microsoft Outlook Task” and of course it should appear in the task window in Outlook. It would seem logical to apply the categories before doing this but resist the temptation, as they still won’t be recognised in Outlook until the next step is completed.
  6. After the task topics have been sent to Outlook, assign categories to tasks from the Categories text tag group in each map and then resync with Outlook. Both assigning category tags and syncing can be done either individually with each task or with a group – again, you may have to sync twice. Once this is done the tasks in your project maps should be identical to their counterparts in Outlook, with the same colour and tag.

    Sample project planning map, synced to Outlook and with Outlook categories applied

    Sample project planning map, synced to Outlook and with Outlook categories applied

Any changes you now make to a task in either program – including category changes – should be reflected in the other once the tasks are synced. Just remember that while multiple categories can be assigned to a task in either program and the text tags are visible in both, MM has no capacity to display multiple colours and therefore topics with multiple categories will have no background colour.

This may be all that some people need to do if they just want to manage tasks from their MM project maps in Outlook, but once this relationship has been established you can use it as a basis for setting up proper dashboard maps where the use of Outlook is optional. I’ll describe this in my next post.

Posted in Mind Mapping, Project Management | Tagged , | 5 Comments

Update: an easier way to export MindManager slides to PowerPoint

A few months ago I described a workaround for one of MindManager’s shortcomings – the inability to export MindManager’s slides as images to PowerPoint. You can export the content of slides as bullet points or as PowerPoint objects, but not the slide images themselves and unfortunately this state of affairs has persisted into the recently-released MM 15.

My workaround drew on a method described by UK mindmapping expert Andrew Wilcox in his blog, which involved using MindManager’s Web export facility to create JPEG image files. I discovered that in PowerPoint the process could be speeded up by using the program’s Insert Photo Album command. Overall this simplified the process but it remains a bit complex, especially at the MindManager end.

I have since discovered a simpler, albeit more expensive export approach. This is to use a JPG image printer to create the MindManager slides as image files which can be easily be imported into PowerPoint using the same Insert Photo Album method. Image printers work in a similar way to PDF printers – the program loads as a printer driver and you then “print” the slides to create a virtual file. The main difference is that with a PDF printer you create a single file but with an image printer the program has to create a separate file for each slide or page being printed.

There are a few image printers on the market but I’ve settled on ImagePrinter Pro which costs around AU$40. It outputs a range of image file types including JEPG, PNG, GIF, TOFF and BMP, and also doubles as a PDF printer. There is a free trial version which isn’t limited operationally but which puts a watermark on each slide.

So after you have downloaded and installed ImagePrinter or another image printing facility the steps to send MindManager slides to PowerPoint are:

  1. Create or select a folder to store the JPEG files. It’s probably best to use a separate folder for each map export
  2. Open a map in MindManager and create the slides you want.
  3. When these are ready go to either the Slides sidebar or Presentation on the View ribbon and select Print Slides. When the dialogue box appears choose which slides you want to print and click on Properties. Check you have the right options under Page Settings and then click on the Options tab and check you have JPEG selected as the file type. Click OK then click on then on Print in the next dialogue box.
  4. Switch to PowerPoint and create a new presentation (beginning the import will create a new “album” anyway).
  5. Under the Insert tab on the ribbon, click on Photo Album and then choose New Photo Album.
  6. When the Photo Album dialogue box appears, click on File/Disk and navigate to the folder you created earlier to store the slide images. Highlight the JPEGS created by MindManager’s PowerPoint export and click on Insert.
  7. The files should appear in the Pictures in Album section of the Photo Album dialogue box. Here you can change the order of the files or remove individual ones.
  8. Under Album Layout choose one of the options. The default is “Fit to slide”, which will fill the whole of the slide with the image. The other useful one is “1 picture with title” which will generate a conventional slide layout with a blank space for the title.
  9. When you are ready, click on the Create button to generate the photo album, which should contain a slide for every map. In addition a title slide called rather cheesily “My Album” will appear; you can either rename this or delete it entirely.
  10. Finally, either format the new presentation or import the slides into an existing one, sorting and deleting them as required.

A few final comments on this approach. First, the process is easier than it sounds and once you have set up the basic parameters it’s quite quick. Second,  the Page Settings dialogue box in ImagePrinter allows you to select quite high resolutions and the resulting images are very sharp. And third, while this method makes the process a little easier, it shouldn’t let Mindjet off the hook; slide image export is something the company should have done years ago. If they want somewhere to start, however, incorporating the ImagePrinter driver would be a great option to consider as a basis for doing this because it does PDF printing as well. This would bring back a feature which many have missed since Mindjet dropped it from MindManager.

Posted in Export, Mind Mapping, Uncategorized, Web 2.0 | Tagged , | 2 Comments

Mindjet: turning over a new (or old) leaf?

Recently James Gardner, Senior Vice President Product at Mindjet, responded to a conversation I’d started over at LinkedIn on some of the problems Mindjet seems to have been having lately, especially with the release of the iOS 7 update of the MindManager app. He commenced with the following apology:

Firstly, I want to apologize to all of you for the issues we experienced with the IOS7 update of our mapping client. There were many reasons, but I shan’t make excuses. We did a bad job. And we’re sorry.

He then went on to discuss the re-release of the app which now works as it should, with “some defects”. He also committed to multiple updates in the coming months and to speed up development so that next time the issue is discussed it will be because “we’ve met your expectations on mobile… and even exceeded them”. He also noted that Mindjet had recently moved to a quarterly update schedule for MindManager for Windows to be more responsive to customers and will release 14.2 “any day”. He concluded with these comments:

Finally, as to our recent acquisition of Spigit (the online enterprise innovation tool), I want to assure you we’re very conscious of our roots, and of the needs of our very loyal user base. We want you to have the best mapping tool in the world, and we’re committed to delivering that…

I thought it might be useful to post my response to James’s apology (especially for those who aren’t on LinkedIn):

Hi James,

As the initiator of this thread I’d like to join the others in welcoming your response in relation to the iOS app issues and more generally regarding the Mindjet’s direction and intentions for MindManager for Windows.

I think your strategy of stabilising the iOS app and then enhancing it through future upgrades makes a lot of sense, though frankly for some of us it’s too late. I’ve like many others have switched to iThoughtsHD which is a stable, well-designed and easy-to-use app with a lot of features which I think the Mindjet app will never replicate (for example, the ability to read and write in multiple formats). However I welcome your commitment to get things right for those who do want to stay in the Mindjet fold.

As for Mindjet for Windows I think the commitment to quarterly upgrades is a great idea and I look forward to seeing the redesigned ribbon. There are a few minor things I’d like to change or add to the desktop version (like reinstating Power Markers or upgrading conditional formatting to be a meaningful equivalent) but I think the main thing is to ensure that there are no more nasty surprises accompanying these upgrades, like the removal of the PDF facility that came virtually unannounced with the 14.1 version.

As for the acquisition of other products and merger with other companies, again I don’t have an in-principle objection but admit I’m a little confused about the direction Mindjet is taking and how all these will affect MindManager, which remains the core (and virtually only) Mindjet product I use. I assume that there is an intention to integrate MindManager more closely with these other products down the line, which is fine, as long as it does not negatively affect MindManager’s core competencies or its rich feature set.

An essential aspect of that feature set is MindManager’s ability to integrate and interact with non-Mindjet products like Word, Excel and Outlook. This interoperability is a critical component of MindManager for me and I hope that Mindjet resists the temptation to follow “walled garden” approach of some other software companies by making it difficult to link with software outside the Mindjet “family”. I mention this only because there was a ham-fisted attempt to do this once before with the upgrade to version 9 when critical aspects of the program’s ability to link with Outlook were arbitrarily removed. This took a customer revolt to fix.

Then there is the business of the poor cousin of the family, Mindjet for Mac, whose feature set has not been upgraded for ages and which seems to be kept on like some embarrassing relative kept in some Dickensian cellar by a family too ashamed to admit its existence or to seek help. When is the poor thing going to be let out into the light and given the same diet of features as its Mindjet for Windows sibling?

Finally there is the need to build and maintain a good relationship with your customers. In this regard I welcome your response but I hope I’m not too cynical in saying we’ve seen this several times before, only to have the commitment to be more consultative, responsive, etc, peter out as the company changed direction and/or key personnel moved on.

I hope this is a fresh start and this time things really are different. If the commitment to engage is maintained I’m sure there are many customers who would love to give Mindjet another chance – and hopefully some former customers who will come back to it.

Posted in Mind Mapping | Tagged , | Leave a comment

Should the MindManager file format be the lingua franca of mindmapping?

Over on the Mindjet forum things are getting a bit heated about MindManager’s lack of facilities to import and export other mindmapping file formats. I have a record of criticising this too, but I think there are two sides to this story. Here is a slightly edited version of my response on the forum.

While I hesitate to re-enter this conversation which seems to be getting a bit “shouty”, but I can see both sides of this debate.

Mindjet obviously see their role as the leading mind mapping player as meaning that they don’t have to worry about playing nicely with their competitors. And like a lot of software companies (Apple, Microsoft, Google, etc) they would love to create a “walled garden” around their products which makes it difficult for users to mix and match formats, programs and cloud storage systems across platforms.

Now I have criticised Mindjet and others for adopting this approach as being very short sighted. It can also be argued that Mindjet’s dominance of mind mapping is not nearly as strong as it once was, but in their defence they still have the largest share of the mind mapping market, at least on the PC desktop.

The problem is that the rest of the market is so fragmented. This means that if Mindjet were to make MindManager more “open” they would have to decide which of their many competitors’ formats to provide import and export facilities for, and then keep these up to date as they and their competitors added or changed features. It is likely that Mindjet have considered the costs of doing this outweigh the benefits of attracting users from other mind mapping programs.

Also it’s not like Mindjet’s position on this is a new decision, a sudden downgrading foisted on unsuspecting users by Mindjet (yes they have form for that, but that is a subject for another time). I don’t know about the early versions of MindManager, but at least since version 8 import and export options have always been very limited.

People might not like Mindjet’s approach but they can’t claim it’s a surprise. And if you are planning to purchase a an expensive bit of new software with the intention of using it with a lot of files that you have created using another application, then it’s your responsibility to find out if the new program can open these files before you buy. Criticising Mindjet over this is a bit like berating Subaru because you’ve suddenly discovered that the sports wheels from your old Ford won’t fit the new Impresa you want to buy (or worse still, have already bought).

Like others I would like Mindjet to provide more import and export facilities, but we should have the same expectations of its competitors. At this stage they do seem to have it easier than Mindjet – it appears they only really need to cater for one file format. If they can import and export MindManager files, everyone seems satisfied.

It pains me to say this and will no doubt annoy a lot of people but it might be best to make the best out of this situation by turning the MindManager format into something a bit like the role that the MS Word, Excel and PowerPoint file formats have as the de facto established standard for office software. Even though Microsoft’s market share is declining, an acid test of any new third party word processor, spreadsheet program or office suite from a competitor is still whether it can accurately read and write Word, Excel and/or other MS Office formats.

Adopting MindManager as the equivalent standard format, a lingua franca for mind mapping files, would go a long way towards resolving compatibility issues. True, Mindjet might end up not having to get off their backsides to address the issue but life would also be simpler for their competitors as well. They would need to provide only one format for importing and exporting files to make mind maps truly portable.

Posted in Mind Mapping | Tagged , | 2 Comments

MindManager to PowerPoint: a post for MM tragics

Well, after announcing the return of this blog with great fanfare, things got delayed a bit…

Anyway, the next few articles will mainly be for MindManager tragics, like me (MindManager being the leading mindmapping program, at least on Windows desktop machines – see here for an earlier article discussing mindmapping). As a dedicated MindManager (MM) user I’ll look at some of the more obscure features of this great program, which I use almost daily for brainstorming, project management, research and a range of other tasks.

Now while I may have called it “great”, MindManager is certainly not without its problems. This first post will deal with one of the more obvious ones – the surprising lack of a facility to export formatted slides to PowerPoint based on branches of the map.

MM’s own slide software can be used to create, show and print slides which are effectively snapshots of the screen, but to export these to PowerPoint there are only two “official” choices; export the map as bullet points, or select the option which relies on PowerPoint’s rather primitive topic shapes and lines to build a very basic presentation.

Users who want to export MM’s own graphics have been forced to rely on a couple of workarounds. For very simple maps, a program like Windows’ snipping tool can be used to grab an image of whole map and paste it in a presentation. For more complicated ones however, most people have gone through the cumbersome process of using image capture software to copy the map piece by piece and pasting the resulting images one-by-one into PowerPoint slides.

Andrew’s brainwave – the “hidden” JPEG route

Andrew Wilcox, a leading UK mindmapping expert, had a brainwave about this, as he describes on his blog. He decided to explore MM’s abilities to export web pages. These turn out to consist of a set of pages in HTML but with images of the map branches saved as JPEGs – in fact, a formatted image of every branch, each focussed on a different topic, down to the map level selected by the user – “hidden” in the web export folder.

This means the hard work of creating a complete set of snapshots of the map has already been done – now all you need to do is extract these images and using them in PowerPoint. I’ll quote Andrew’s steps on how to do this:

  • Open the map.
  • Export to web using the Presentations template (Andrew suggests playing with the Customize – Advanced settings in the template to get the best results).
  • Create a new PowerPoint presentation or use an existing one.
  • Then insert and link the image files you will find in the web export folder.
  • Tip: It helps to sort the folder by file type.

This is quite effective, though for some reason I’ve never been able to get Insert and Link to work properly in PowerPoint 2010 so I just use Insert. This means I miss out on the ability to refresh the PowerPoint presentation automatically every time the map is updated.

Andrew wondered in his post if he had missed something obvious in PowerPoint to speed up image importing in a similar way. It occurred to me that what was needed was a mechanism for the batch processing of the import of image files – and too my surprise, a web search revealed that there is indeed such an option.

I’ve outlined this approach below, followed by a few other options to create a PowerPoint presentation from an MM map.

PowerPoint’s Photo Album – batch importing of images

The batch process I mentioned is “disguised” as PowerPoint’s Photo Album command. Part of the reason this feature gets overlooked is its command name; “Photo Album” suggests that only photography enthusiasts would be interested, but like MM’s web export this feature has much wider potential. Effectively it means that multiple images from any source can be imported to PowerPoint and pasted into separate slides in one process.

This involves the following steps (based on PowerPoint 2010, but other versions should be similar):

  • Open a map in MindManager and filter it to show only the topics you want to export, then create a web export as discussed above.
  • Switch to PowerPoint and create a new presentation (beginning the import will create a new “album” anyway).
  • Under the Insert tab on the ribbon, click on Photo Album and then choose New Photo Album.
  • When the Photo Album dialogue box appears, click on File/Disk and navigate to the web export folder you created earlier in MM. Highlight the JPEGS created by the web export and click on Insert.
  • The files should appear in the Pictures in Album section of the Photo Album dialogue box. Here you can change the order of the files or remove individual ones.
  • Under Album Layout choose one of the options. The default is “Fit to slide”, which will fill the whole of the slide with the image. The other useful one is “1 picture with title” which will generate a conventional slide layout with a blank space for the title.
  • When you are ready, click on the Create button to generate the photo album, which should contain a slide for every map. In addition a title slide called rather cheesily “My Album” will appear.; you can either rename this or delete it entirely.
  • Finally, either format the new presentation or import the slides into an existing one, sorting and deleting them as required (see comments below).

The following images capture key stages in the process:

Export MM Map to PowerPoint 1

1. The original map


Export MM Map to PowerPoint 2

The MM Web Export dialogue box

Export MM Map to PowerPoint 3

PowerPoint Photo Album import dialogue box


Export MM Map to PowerPoint 4

Slides as imported to PowerPoint, including the “photo album” title slide

The great thing about this approach is that once you have created the presentation you can use the Edit Photo Album command to update it. Admittedly this is a little clumsy – you have to remove any topics you have edited and replace them with the new ones which results in a new presentation being generated, but any slide headings and formatting added after the initial import should be retained. However if you delete any slides you may affect the relationship between these headings and the remaining slides.

So, now to some of the “ifs and buts” associated with the Photo Album option:

  • This approach generates a lot of slides – literally one for each topic down to the map level you have selected – usually sorted in alphabetical rather than map order. You can sort and edit the original JPEGs during the import process, but it’s probably easier to do this once the slides are created.
  • There is an option to insert a link in the photo album dialogue box but in my experience (and that of several others who have described the photo album process) this doesn’t seem to work.
  • The index JPEG which shows the full map is always fuzzy and the text unreadable. It turns out the sole purpose of this image is to act as a thumbnail image on the web page, so it is generated at low resolution. If you need a full map you will have to capture it using the Window’s snipping tool and import it manually.
  • A blue box is placed around the topic which is the focus for each slide. However this can be removed in the advanced settings for the web export.

On the positive side the process is relatively quick and the JPEGs are better quality than those obtained by capturing map images. I also imagine it would be possible to automate the process to a large degree using two macros – one in MM to create the web export, the other in PowerPoint to import the maps.

Using MindManager’s own slides

While direct export to PowerPoint of MM slides isn’t possible, you can achieve much the same outcome by using third-party software. This gives the user much greater control over which topics are used for the presentation and you could preview the slides within MM.

There are several approaches but they all start at the same point; creating the slides you want in MM then using a PDF printer driver to “print” the slides in PDF format (while Mindjet have deleted the Adobe PDF print driver from the latest upgrade of MM 14, you can get Adobe Acrobat or third-party print drivers which are cheaper or even free). After doing this you can go one of three ways:

  • Use Adobe Acrobat or Adobe Reader to “present” the PDF file. This is a surprisingly effective option, especially as the Reader program is free and probably more widely available as PowerPoint. In either Acrobat or the Reader go to View and select Full Screen Mode to mimic a PowerPoint presentation. Go to Edit and then Preferences  to change how this mode will behave, for example adding transitions between pages.  While the result is not as sophisticated as a PowerPoint presentation it is surprisingly useful. You can also combine the slides with others generated in PowerPoint as part of a larger presentation if you save the latter to the PDF format, providing you have Acrobat or other PDF editing software.
  • Use conversion software to create JPEG files from the PDF file. Under this approach you use a third-party batch conversion program to convert the PDF pages into JPEG files and then insert these into a PowerPoint presentation either manually or using the web export approach described earlier.
  • Use Adobe Acrobat or third-party software to convert the PDF file directly to a PowerPoint presentation. Probably the best way to do this is with Adobe Acrobat, but this feature is available only in the latest version 11 and the cost of purchase or upgrade is quite high. However there are a number of third-party conversion programs which can do this with varying degrees of success. One thing to watch in doing this is whether the resulting PowerPoint slides are static or editable. While the latter may seem more desirable, often it is only the text itself which can be edited but not its position on the page, which can lead to strange results if the slide graphics are resized.

A word of caution regarding these options. I have not been able to review all the third-party programs so I don’t feel I can make recommendations, however it is clear that a number of “free” PDF drivers, PDF-to-JPEG and PDF-to-PowerPoint converters are not so free after all. Many require paid upgrades to work properly, or they involve advertising or worse still, they load adware and other programs without the user’s knowledge or consent. It’s important to read the reviews and to check out online comments about these programs before you select one to download.

Posted in Export, Mind Mapping | Tagged , | 1 Comment

A new direction…

After a long period without posting I have been wondering about the usefulness of this blog and its future.

When I started Sociamind in May 2009 I was interested in exploring the usefulness of social media and “Web 2.0 applications” for small organisations, councils and government agencies and “new and exciting ways” in which these could be used to engage with the community.

While the term “Web 2.0” has all but disappeared, the rise of social media over the past four years has been unstoppable. Once regarded with ignorance, indifference or outright suspicion by councils and small organisations, many have now embraced social media through Facebook pages and Twitter feeds. And while Web 2.0 no longer has much currency as a description, councils in particular are exploring new ways to interact with their communities online.

However it is the explosion of smartphones and tablets over this period that has really changed the landscape, fundamentally altering the ways in which organisations operate. Not only are their users, customers and clients increasingly accessing their services from mobile devices, their own work practices have been transformed. Smartphones and tablets provide an incredible range of functionality for their workforces beyond just communication and internet access – GPS location, mapping, photography, presentations, referencing technical documentation and record keeping, to name a few.

So in the short time since I started this blog, social media, web-based software and mobile applications have moved well beyond the exploratory and educational phase to become mainstream. Therefore this area is possibly less relevant, though there is still plenty to write about.

After some deliberation I have decided to continue this blog, though it will move away from this exploratory and educative role.  I will also write more about specific applications – across mobile, web and “traditional” PC-based platforms – that particularly interest me and which are potentially useful for small organisations. I’ll be kicking this off with a series of posts aimed primarily at MindManager nerds. As well as being a key tool for me I think MindManager can be extremely relevant for councils and community-based organisations

Posted in Community Sector, Local Government, Mind Mapping, Social Media, Web 2.0 | Tagged , , , , | Leave a comment

The software subscription model: will consumers buy it?

A response to my last post on Mindjet’s flawed and ultimately unsuccessful attempt to move its entire user base to a subscription model asked whether even major companies such as Adobe will ever succeed in convincing their customers to rent rather than purchase their software outright, especially in an era in which major businesses often hang on to operating systems and software for years before upgrading.

I don’t know the answer to that question but I think that for many “traditional” software companies it may be a case of being stuck between a rock and a hard place. If they attempt to move to a subscription model they run the risk of losing customers who either dislike on principle the concept of renting software or who don’t want to pay the higher net costs of subscribing, compared to purchasing an upgrade only every five years or so.

On the other hand if they stay with the perpetual licence model they also run the risk of losing custom to cheaper alternatives, for example the developers of new mobile apps and online service providers. These may not offer the same range of features and may also involve subscriptions, but they often perform better at core tasks and the subscription costs are substantially cheaper (in some cases perhaps unrealistically cheaper).

This started me wondering about how and in what circumstances subscriptions are likely to succeed, especially for those companies that are moving into this space for the first time. I don’t pretend to be an expert on this, but as an interested software consumer here is my take on some of the questions these companies should be asking:

  1. How relevant or useful is a subscription model for the product? The subscription approach seems to be a better “fit” for some products than others. Consumers seem to find purchasing subscriptions for products that are inherently web-based or more easily used online (for example web-based collaboration tools and cloud storage) to be much more acceptable than the application of the subscription model to specialist programs that are PC-based, especially those that are heavily graphics or CPU-intensive.
  2. Where are the files and data produced with the software stored? Related to the issue of the nature of the software service is the issue of where the outputs are stored. Again, if they are stored online, users seem to find subscriptions more acceptable. However, there seems to be strong resistance when files continue to be stored on the user’s computer; customers seem to resent the possibility that if they let their subscription lapse they will be unable to access their own data on their own computer. Many corporate users also have requirements regarding data security and access which makes them wary of subscription models.
  3. How accessible is the product and the associated data? If something is offered on a subscription basis, there is an expectation that it will be accessible across a range of devices and locations. There is also an expectation that it will be easy to get data into and out of the software; files should be able to be imported and exported easily. Apart from the obvious benefits this also helps to reassure users that if they let their subscription lapse – or if the company goes belly-up – they will still be able to access their data.
  4. Does the subscription price offer value for money? This is the critical area in which most attempts by “traditional” companies to move to subscriptions founder, because they base their pricing on what they have charged for perpetual licences and upgrades, with an assumption that users upgrade every time a new version comes out. This approach is flawed for two reasons:
  • First, as noted earlier, many users with perpetual licences hang on to the same program for years, often skipping several upgrades, in order to reduce costs. This applies to particularly to many non-profit organisations as well as individuals, but it is also common practice in the corporate sector.
  • Second, the rise of the low-cost app for mobile devices and the introduction of new products with very low subscription pricing by start-ups in the online arena not only has introduced direct competition for the core business of traditional software providers but also radically changed consumer expectations regarding what they are prepared to pay for subscriptions.

The upshot of the last point in particular is that many of the subscription charges sought by traditional companies are quite unrealistic. The company that comes closest to “getting” the subscription model is perhaps surprisingly Microsoft, which charges US$100 a year for a subscription for a full version of Office for five computers; the one that seems to have most misread its market and the new pricing climate is Mindjet which is still trying to charge a whopping US$360 a year for its business bundle for a single user.

Somewhere in between are companies like Adobe that are charging US$600 a year for the complete suite of its graphic products and $240 for most individual programs. This is probably good value if you need the whole suite, but much less so for an individual program and many of these users are likely to look elsewhere.

I suspect that a realistic pricing level for subscriptions is probably no more than about $50 a year per user for a single program or (to follow Microsoft’s example) $100 a year for a comprehensive software bundle, but including business as well as home users. Even at that level there is no guarantee that customers will warm to subscriptions; Microsoft’s attempt to trial them in Australia around a decade ago ended in tears when people failed to understand that the subscriptions would expire after 12 months. Eventually Microsoft replaced all the subscriptions with perpetual licences.

I’d be interested in what people think about the attempts by established software companies to shift their customer base to subscription pricing. What are the benefits (if any) for users and whether and under what circumstances will this push succeed?

Posted in Cloud, Mind Mapping, Software | Tagged , , | Leave a comment