
In my previous posts I covered how to sync MindManager (MM) tasks with Outlook and then how to use this relationship to create an interactive dashboard which can provide a basic snapshot of progress across multiple projects and maps. Once you understand the basic techniques involved you can use dashboard maps in a variety of ways (which I’ll explore in the final part of this series), but first it’s important to realise that there are some major limitations and issues to be aware of.
1. The need to get the syncing sequence right. It’s important that categories are created in Outlook first then sent to your project planning maps in MM, then tasks are sent from MM to Outlook before categories are applied to them in MM (or Outlook) and the tasks are then re-synced. Only then can the dashboard maps are created.
2. Not everything can be synced between the same tasks in MM and Outlook. Once tasks have been synced the following task elements are synced also and therefore will appear in the original project map, Outlook and the dashboard map. These can also be edited in the original project map, the dashboard map or in Outlook, though some need to be initiated in Outlook, as indicated:
- Topic text, though care must be taken when doing this especially from within the dashboard map to ensure you don’t create “orphan” topics.
- Categories and category colours, but in MM the colour is displayed when only one category is applied to the task and may be overridden by MM’s At Risk and Past Due topic colours. Categories must be initiated within Outlook rather than MM but can be modified in either program.
- Task priority, though Outlook recognises only three levels, high medium and low; anything below that is regarded as low and will appear in a dashboard map as a 3, while still retaining the original value in the source planning map.
- Task progress, as a percentage.
- Task start and due dates. Duration is not shown in Outlook but is separately calculated from these dates in both the original and the dashboard maps.
- Task status. This is shown as a topic property and is initiated from Outlook, though it can be modified in either program from a drop-down menu.
- Topic notes.
- Attachments. These will appear in the Outlook topic notes and after syncing in the MM topic notes as well as remaining as attachments. They will appear in dashboard maps provided
The following task elements are not synced with either Outlook or the dashboard map, but are retained in the original project map:
- Any flags, icons etc (other than those showing priority and progress, which are synced).
- Topic colouring except where this is associated with a category in which case it will be synced (though these may be overridden by MM’s At Risk and Past Due topic colours).
- Topic numbering.
- Topic labels.
- Images inserted into the topic.
- Hyperlinks.
- Subtopics.
- Callouts.
- Task effort.
The following task elements are not only not synced with either Outlook or the dashboard maps, they are actually removed from MM maps by the syncing process:
- Topic properties – in fact, if any have been defined for the topic these have to be deleted before the topic will sync with Outlook, after which Status is applied and retained as a topic property.
- General tags, or tags created within any user-defined tag group other than the Categories group imported from Outlook.
- Resources added from MM – indeed, once a task is synced, it becomes impossible to even add a resource to the same topic in MM. However, MM will show as a resource (but not allow you to edit) the email of an assignee if the task has been assigned to someone in MM.
For obvious reasons the last two are the most serious limitations. Resources can only be managed from the Outlook end and it is not possible to have any MM text tag in a synced map apart from those used for categories. Worse still, if any a map has been set up with either resource allocation or general or user-defined tags in MM, these will be summarily removed by the syncing process.
3. Creating too many dashboard maps can cause problems. There is a risk that the syncing process can become corrupted; it’s definitely a good idea to avoid dashboard maps based on other dashboard maps as this will end up duplicating tasks in Outlook and result in confusion.
4. Over- editing tasks in dashboard maps could make them “orphans”. Similar to the point above, there is a risk that making too many changes to individual topics in a dashboard map could result in them becoming “orphaned” from their original project planning maps. Dashboard maps are best suited to managing project progress and status, with other changes being made in the planning maps.
5. There are limitations in using MM’s Outlook Queries…. While Outlook queries offer a lot of options when you are setting up dashboard maps in MM, there are some limitations. Probably the most annoying is that while tasks can be sorted by start date, end date or priority it is not possible to restrict the list to only those tasks that fall due within the date range without using the filtering method I have described. Similarly while it is possible to set a date range relative to the current date (for example, the next – or the last – 10 days) and fixed date ranges, it is not possible to set a future relative range such as the week after next. Another minor quibble is that while you can select any one category or query on all categories and group by them, you cannot select, say, three or four categories only.
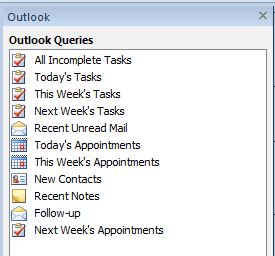
MindManager Outlook Queries, showing pre-set query list
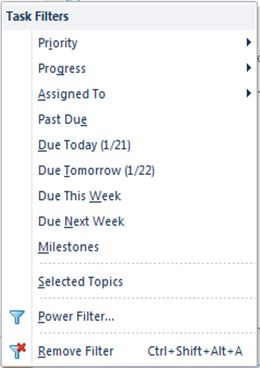
MindManager Task Filters, showing list of pre-set filters
6. …and Power Filtering. While MM’s Power Filters are quite powerful and the ability to use them with Outlook queries in MM offers great flexibility, there are still some limitations. On the plus side there is a much wider range of topic items you can filter on and while the options for filtering tasks by date are similar to those offered in the Outlook Query filter there are some interesting additions, like the next two weeks and the next month. However there is still no opportunity to set a future relative date range. I won’t go into the other complexities of filtering here but it is important to remember that unlike Outlook Queries which can be added individually or separately to a map but in isolation from each other, multiple Power Filters can also be applied but they work cumulatively and more importantly affect the whole of the map. This means, for example, that if a filter relating specifically to tasks is run, any query relating to another Outlook item such as email will not appear in the filtered map.
7. Task roll-up information and the Gant charts in dashboard maps are useful but can be misleading. If category grouping is applied to an Outlook Query in a dashboard map, the categories may appear as main topics and task roll-up information will be applied at this level. Note that this behaviour is a little erratic – in my previous post I said they always appear but that is not always the case, though roll-ups can easily be added. It’s important to note however that the roll-up icons on categories in dashboard maps relate solely to the items displayed in that map and don’t present the total picture for each project. To complicate matters further, power filtering does not change the roll-up icons in dashboard maps for those categories which are still displayed. There are similar issues with Gantt charts, which may show the full duration of projects which run through and beyond the Outlook Query period but only those tasks which fall within this period.
In the next and final post I’ll outline some of the potential uses of this approach.

Pingback: Using MindManager dashboard maps with Outlook: part 4 | Sociamind
Pingback: What happened in Sociamind in 2015? | Sociamind