
If you use MindManager to categorise information the resulting groupings in the Map Index are often just as significant as the topics themselves. This is especially the case if you use MM’s tag feature as a basis for research, a process I described back in 2017.
In that post I described how to use MM to undertake basic quantitative and qualitative analysis with small data sets such as survey results or interview transcripts. MM’s potential use as a tool in this area has been enhanced by the revelation that comparison and logical operators can be used in MM formulas. This, along with the introduction of SmartRules means that topic properties can also be used as part of the analytical process.
However, there was one feature I didn’t fully explore in my 2017 post. While I described how to copy individual tag groups into a new map, I didn’t realise back then how simple it was to create a complete “reverse map” based on the Index categories simply by exporting the whole index. This can provide a whole new perspective on your data.
Creating a reverse map
All you need to do to make a reverse map is open the Map Index pane, then click on the ADD drop down menu and select Copy Index. Create a new map and simply paste the copied index. A new map should be created in which the main topics will be the names of groups used in the Map Index; only those groups whose icons, tags or other elements have been used will appear in the map. If fill or font colours have been used these will also appear as main topics.
The sub-topics under each main topic will be the names of the items from that group used in the source map. In the case of tags, resources and Kanban these will be, respectively, the tag names, resource names and Kanban stages. For all groups involving symbols and icons such as Priority, Progress, Flags, Icons etc, the name associated with the symbol or icon will appear as sub-topics. Similarly for fill or font colours the RGB numbers for each colour will appear.
In turn, under each of these all the map topics to which these symbols, icons, tags or colours were applied in the source map will appear as sub-topic. Obviously, this means that the same topic can appear multiple times in the map of the index depending on what attributes have been applied to it.
The following images show the different stages. The first map shows the hypothetical results of a survey of a group of artists regarding their preferences for various forms of video and online presentation. These are shown using tags.

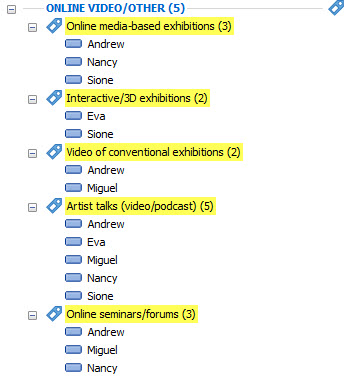
The following image shows the relevant tag group in the Map Index. The objective is to create a map of this index.
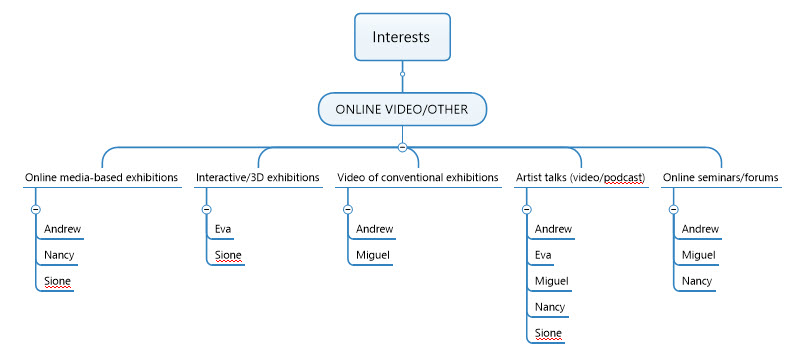
The final image shows the map created by copying the Map Index. The tags have become the main topics, with the names of the artists appearing as sub-topics under each tag. Obviously, each artist can appear multiple times. This information can be used, for example, to set up different interest groups or to allocate resources. Note the central topic is not renamed automatically.
Limitations
There is no way to nominate specific groups to be included or excluded in the map prior to copying. This means that a lot of the groups appearing in the exported map (such as fill and font colours, unless you are using them deliberately instead of tags or icons) are likely to be redundant. This is annoying, but easy to deal with; simply delete the redundant main topics.
The topics are really only the names of the topics as they appear listed in the Map Index. This means that all topic information and properties originally associated with each topic in the source map will not appear in the index map.
There is no way to “round trip” between the source map and the index map. The topics are not linked and every time there is a change in the main map the index will have to be copied again and the reverse map recreated. Similarly, any subsequent formatting you apply to the exported map will have to be reapplied, though this can be overcome to some extent by developing and applying a specific theme for these maps.
When using this technique as a form of analysis it is difficult to record the number of sub-topics in each category item, even though this is shown in the Map Index. Of course, you can show the number of subtopics by collapsing the branch, but these counts are not available to use elsewhere.
There are a couple of ways to overcome the last problem. The first is to create a numeric topic property with a value of 1 which is applied to all the source map topics you are trying to count in the reverse map. At the category item level, you can add a formula to count the number of these topic properties. Alternatively, if you have the MAP add-in you can utilise the Extended Properties feature to add the Sub-Topics (Children) topic property which will count the sub-topics.
Exporting to Word via a reverse map
You can copy the Map Index and paste it directly into a Word document, but the result will probably be disappointing. This is because the index is pasted without any formatting, apart from indentations, which Word cannot translate into a document hierarchy based on Word heading styles.
The solution is simple – first copy the index to create a reverse map using the technique described above. Edit this as required and then use the Word Export feature to create the appropriate hierarchy in the resulting Word document.
Comments
Reverse maps are a very effective analytical tool, especially when combined with processes to count the number of topics in each group. They are also simple to use, but some improvements could be made to make reverse maps more accessible and effective:
- A specific command on the Map Index Add menu to create a map of the index;
- The ability to select which groups to include or exclude when either copying or mapping the Map Index;
- An option to select a specific map theme to apply when mapping the Map Index;
- An option to export all the topic information attached to topics when copying or mapping the Map Index, and not just the topic name.
More generally, both sub-topic count and topic level should be made available as topic properties in all maps.
