
It seems that MindManager 2017 is a work in progress. Normally Mindjet makes incremental changes between major upgrades – and these are sometimes as much about taking out features, or fixing problems with previous additions as they are about adding anything new – but this approach has been upended with the release of the latest update, MindManager 2017.1 ( which I’ll refer to as MM 2017.1).
MindManager 2017 was a fairly substantial upgrade in its own right and apart from Mindjet’s commitment to continue making improvements to its new HTML export feature there was little to indicate that the first point upgrade would do more than tidy up a few loose ends. I was surprised therefore to see that the release notes for MM 2017.1 contained a whole page of updated features.
By far the most significant of these is the new dashboard map facility which Mindjet has slipped into the standard as well as the enterprise version of MM 2017.1 with little fanfare. For the first time, users can create a single map which can pull together and summarise data from a range of other maps and, most significant of all, keep this rolled-up information up-to-date.
This feature is so new that when I looked I couldn’t find any advice on it in the help file. Hopefully this will be sorted out soon but thankfully it seems relatively simple to use – which is just as well, as a lot of MM users will be eager to try it out.
You would think that easily-updateable dashboard maps would be an obvious fit for MindManager, given its very strong suite of project and task management tools, but it has taken third-party add-ins to bring this feature to market. These tend to come and go, but the best-known add-in with multi-map capability, ResultsManager, has recently been updated for MM 2017 and is now available through Olympic Limited. Results Manager is a great and extremely powerful add-in but it is also complex and given its price may be overkill for some users.
As an alternative in early 2015 I published a series of articles on a dashboard map work-around which involved synchronising tasks from one or more project maps with Outlook and then using MM’s powerful ability to query Outlook to generate and update a single dashboard map to monitor progress on these tasks. This approach is also somewhat complex and relies not only on access to Outlook but also Mindjet’s continued retention of the Outlook sync feature.
At a stroke Mindjet appears to have provided a simple and effective alternative. I’m still playing with the new dashboard maps, but so far I’m happy to say that while they take a bit of time to set up the process is straight-forward and the resulting maps can be updated on demand – or will do so automatically every time they are reopened. Furthermore, while they are intended primarily to show task progress, dashboard maps will also automatically update any changes to topic content and properties as well.
Before you set up your first dashboard, check that you have the right version of MindManager. You need the latest MM point upgrade – 2017.1, and preferably 2017.178 or higher. If you open up MindManager and can see the Map Roll-up icon on the Advanced tab of the ribbon in a Dashboards group with the Outlook icon, you are good to go.
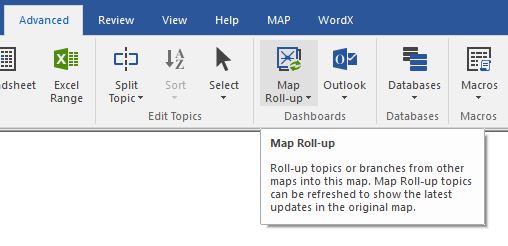
Map Roll-up icon on the Advanced tab
To start you need to create or open one or more project maps to provide the source topics and then create a new map to be the dashboard map which will link to these. Normally this would be a separate map, but you can also create a roll-up map based on a floating topic in one of your existing project maps. I’ve done this in the examples below but I suggest that you avoid doing this at least initially as any filtering will apply directly to both the existing map and the roll-up map which can be very confusing.
In the first example I’ve set up a very basic source map with one test topic. To create the dashboard create a new map (either as a new file, or based on a floating topic in the same map) with a single blank sub-topic for the topic you want to roll up. This will become the rolled-up topic and is the only confusing thing that you have to remember – the process will convert the existing highlighted topic to be the rolled-up topic and not (as you might expect) attach the rolled-up topic to it.
Highlight this topic, click on the dropdown arrow under Map Roll-up under Dashboards on the Advanced ribbon and then click on Create New Map Roll-up. You will be taken immediately to your default map directory.
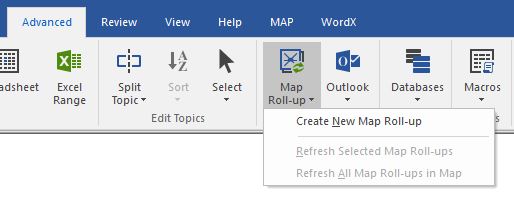
Map Roll-up menu options
Select the map you want and open it (and yes, you must do it this way even if you are creating the dashboard map based on floating topic in the same file). You will be presented with the Select Topic to Roll-up dialogue box which will be a mini tree representation of the map down to the main topic level. Click on the cross next to the relevant main topic you want to expand; repeat this until you come to the subtopic you want, then click OK. The subtopic in your dashboard map will promptly be converted to match the equivalent subtopic in the main map:
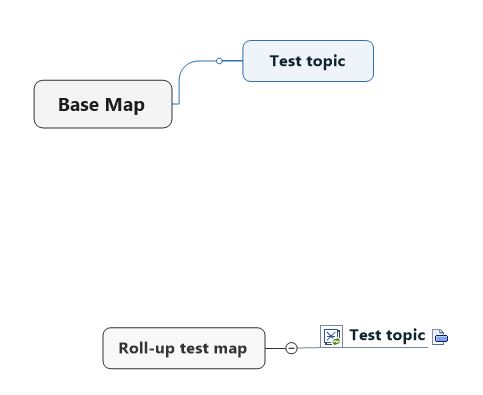
Basic example of a dashboard map with roll-up
That’s pretty much it. You will need to repeat this process for all the other topics in this or other maps you want to include, as there appears to be no way to select multiple topics. You can however apply the roll-up further up the food-chain, as it were, to capture entire branches.
The rolled-up topic created by doing this should have two icons. When clicked the one on the left has a drop-down menu of commands – whether to show the topic only or the branch as well, to refresh the map roll-up or to disconnect it. The button on the right will take you to the source map and the topic that’s being rolled up (or if you building your roll-up map using a floating topic, to the originating topic in the same map). If the topic you selected to roll up has subtopics and you elect to display the branch these will appear but won’t have the two icons.

Context menu on dashboard map rolled-up topic
Having set up your first rolled-up map you can now play with it. Return to the main map and edit any aspect of the source topic (or if it is the top of a branch, any of its sub-topics) – the contents, topic properties or task information. Then return to the dashboard map and click on Refresh All Roll-ups in Map. The dashboard map should update immediately to reflect the changes in the source map.
The opposite – trying to update the main map from the dashboard map – isn’t possible as the dashboard map is read-only. You can however implement a conventional task roll-up on a higher topic or the central topic within this dashboard map. You can also sum the values in topic properties and apply other formulas in the dashboard map.
In the following example I’ve tried to show some of the power of this new feature. I’ve created a hypothetical stationery company that’s a bit old school – its four branches sell only pen and paper. These branches are also undergoing software and fit-out upgrades. This activity is captured in the first map below which incorporates both example topic properties and task information (note that you can just as easily incorporate material from different project maps in the dashboard):
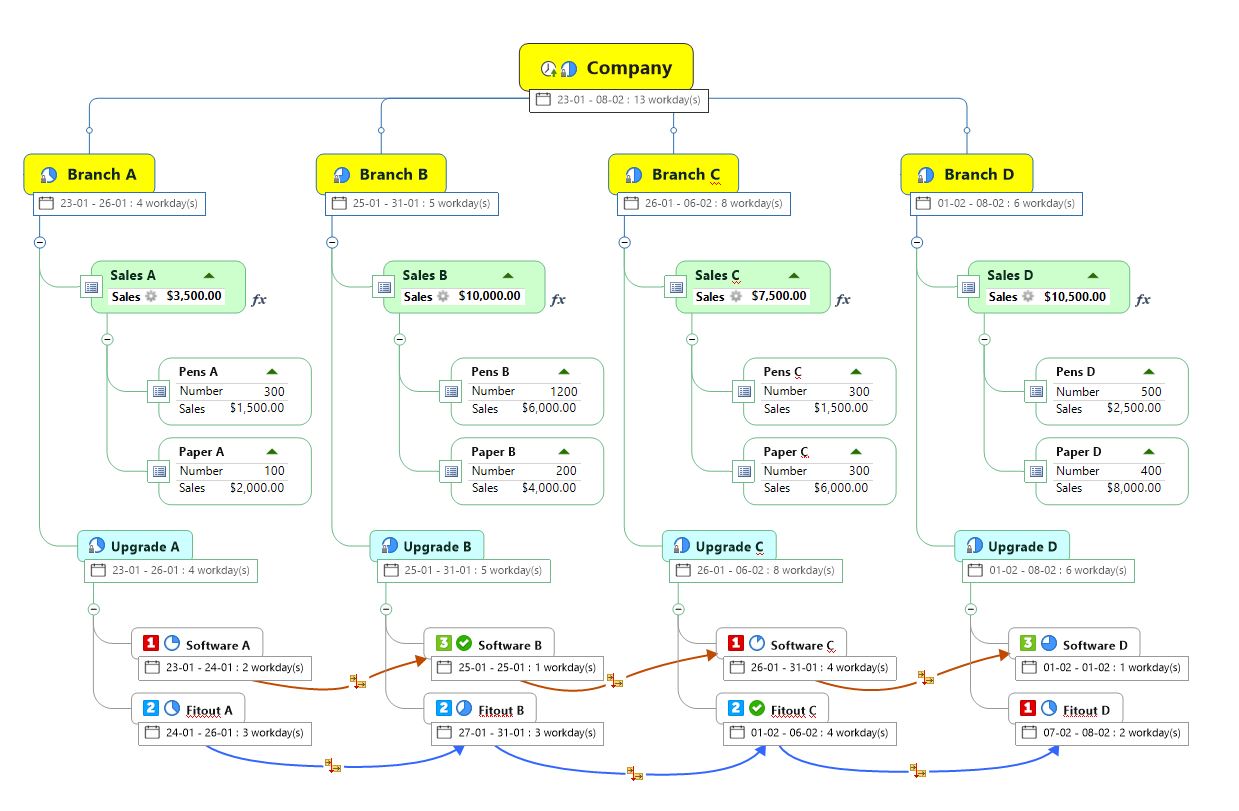
Hypothetic company – and hypothetical activities
The second map uses the roll-up feature to pull out the sale of pens only, totalling both the number and value of sales in topic properties across the four branches:
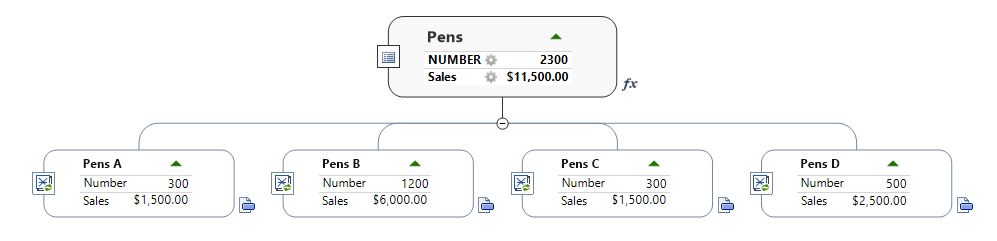
Roll-up map showing pen sales
The third roll-up map shows the overall total value of sales of pens and paper, again rolling up the relevant topic properties:
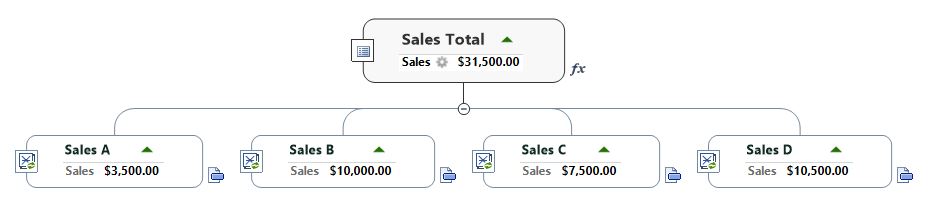
Roll-up map showing total value of sales
In both these maps any changes made in the source topics will be reflected in the rolled-up maps when they are refreshed. This applies to both the topic properties and the topics themselves.
The final map shows the special usefulness of rolling up tasks. In this map I’ve rolled up just the software upgrade from my hypothetical example, demonstrating how you can track progress of a particular type of task across different branches and indeed different maps independent of other task types. Previously this was difficult to do even within a single map (in my experience at least) as filtering for tasks did not change the overall resource total in the map. Again, changes to any of the task information in the source topics will be reflected in the rolled-up map:
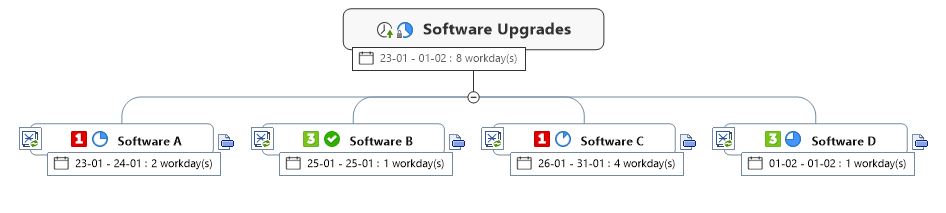
Roll-up map of the software upgrades
My conclusions on the new dashboard map feature? There are a few rough edges – for example, it would be very helpful if you could default in some way to a specific map as a starting point rather than go through the process of selecting and opening a file every time you add a topic or branch to the roll-up. Similarly, it would speed things up considerably if you could select a group of topics from a map to be rolled up, instead of having to do this one topic or one branch at a time. Not all topic formatting (for example, fill colouring) is transferred to the roll-up map for some reason and while the rolled-up topics are meant to be read-only you can still edit their topic properties (which I suspect is a bug).
These are relatively minor issues however and what I’ve done so far has only hinted at the power of this new feature, so I may write a follow-up article after further exploration. My one real remaining concern is that the introduction of dashboard maps has come at an unfortunate time for the release of the upgraded version of the ResultsManager add-in, though the latter is even more versatile and will hopefully continue to be relevant to power users.
Updated to correct typos and to provide more detail on some of the processes described.
A copy of the example map can be downloaded from here.

Pingback: Addendum to the dashboard maps post – a dashboard map example | Sociamind
Great article! Thanks for making me aware of this much needed and waited for (10+ years) feature in MindManager. Hopefully there will be two-way editing in the near feature.
LikeLike
Thanks for the feedback Tom and I agree that two-way editing would be a great enhancement.
I can understand however why Mindjet might be moving cautiously on this one, as there could be some situations where two-way dashboard maps may be very problematic – for example, where organisations want to control access to the original maps or simply want to avoid bits of them being deleted accidentally by staff or others who might not understand that the map they are working on is only a dashboard. I think there would probably need to be three options made available on a map-by-map basis: one-way editing as at present and at the other extreme full two-way editing but also an intermediate option where the contents of the topic (and where relevant of any topic notes) are locked but topic properties and task progress information can be edited on the dashboard.
LikeLike
Pingback: New tricks with MindManager, HTML 5 exports and dashboard maps | Sociamind
Pingback: Corel and MindManager 2018 – adding the new, transforming the old (part 1) | Sociamind